EEGLAB -- A pre-tutorial
This is a rapid tutorial intended at giving you some feeling of what
you can do with your data using the alpha version of FMRLAB.
NOTE:EEGLAB is still in alpha development -- many details of the menus have been reorganzized since the following was written. This tutorial will be updated upon release of the beta version of EEGLAB, expected in April, 2002.
For a more comprehensive and detailed tutorial,
you can go directly to the EEGLAB help menu. The tutorials are diverse
ranging from quick overviews to specific tutorials going into details
of complex functions.
Reading or Loading a data set
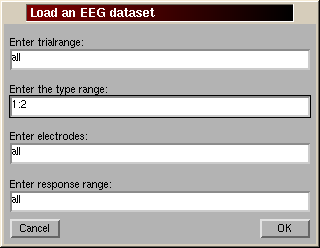
To read a Neuroscan EEG file
Go to the FILE menu LOADEEG and browse your directories to find a Neuroscan EEG file. Type open.
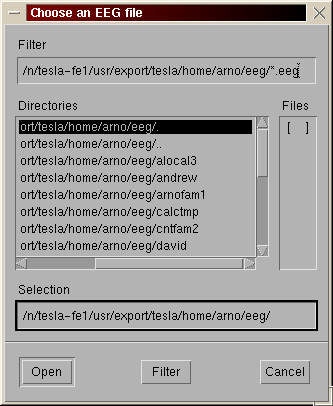
A second window appears. Hit the "OK" button if you just want to read the file. Otherwize set the trials, electrodes... you want to read. In this example, only trials of type 1 and 2 will be read (the entry respect matlab syntax).
To create a dataset from scratch - editmenu
Read an array of EEG activation into matlab (load -ascii FILENAME will load the ASCII file into matlab and store the array in the FILENAME variable)
Use the menu EDIT, EDIT/CREATE DATEASET. Enter the global variable name into the data field (in this case mydata). My data must be organised as a 2D or 3D matrix array You must also provide several other optional informations (note: the number of frames per epoch is not optionnal if you have 2D data otherwise, by default, EEGLAB will consider your data continuous (1 trial)). The software will check for the consistency of these variables and may modify them. You can modify these parametes at any time by going back to this menu.
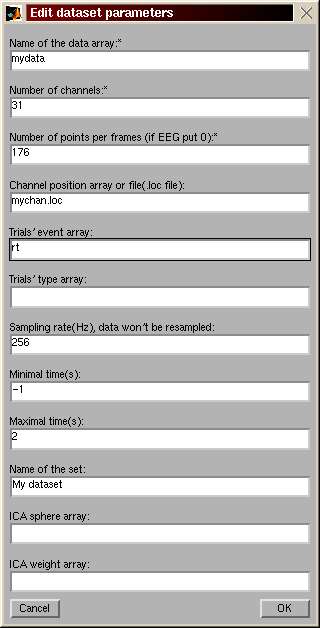
Note that the file that contain the location of the electrodes has a spetial format (see online tutorial).
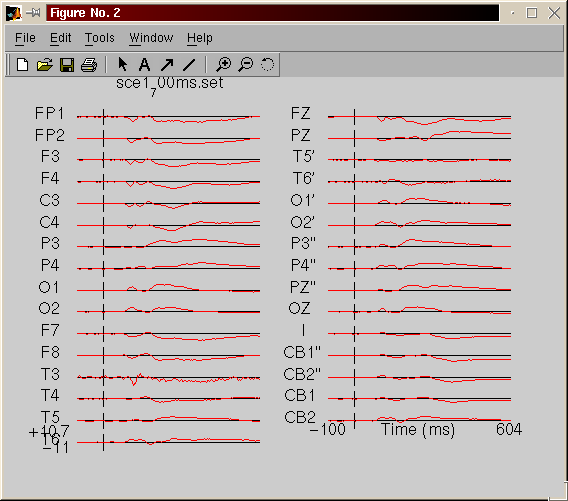
Use PLOT menu function to visualize your data
This is a quick overview. You should use the tutorial (in EEGLAB, help tutorial) for more information. Note also that these function are part of the ICA toolbox.Plot the avarage of each channel - menu plot, EEG average
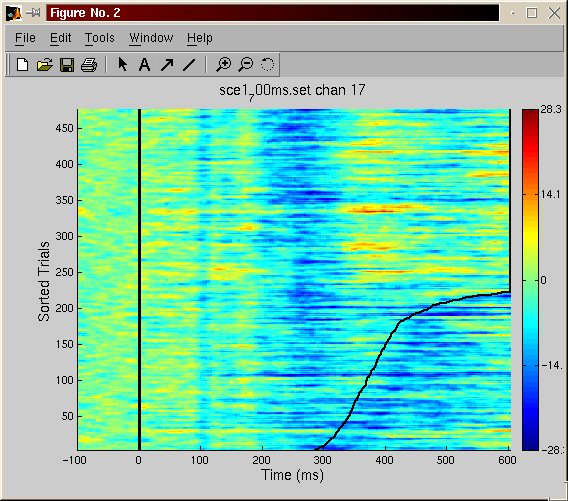
Plot the ERP image of the data (each single trial being a simple line and the trial being sorted by the reaction time of the subject) - menu plot, EEG or ERP image
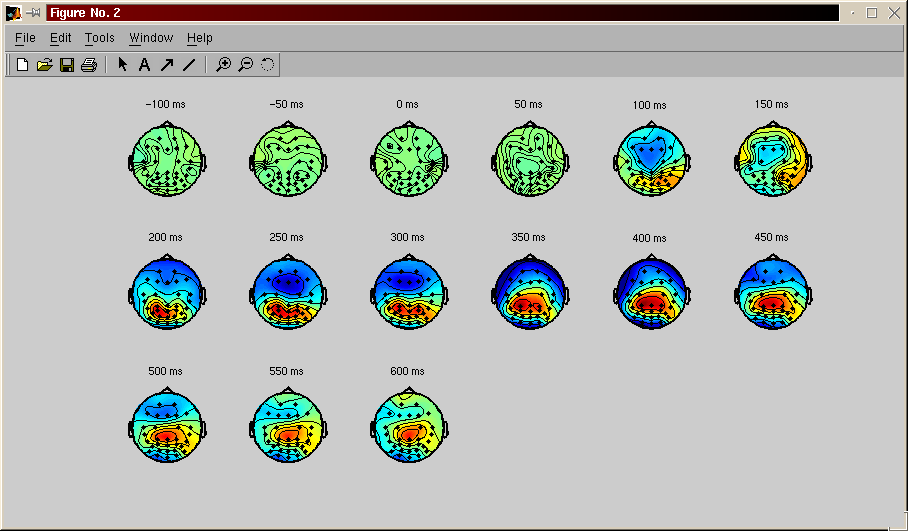
Plot the topography of the EEG activity at different latencies (mean of all trials) - menu plot, EEG topographical map
They are more ploting function in the software. EEGLAB have also
a set of function to display the characteristic of independant components
(computed using ICA).
To reject artifacts
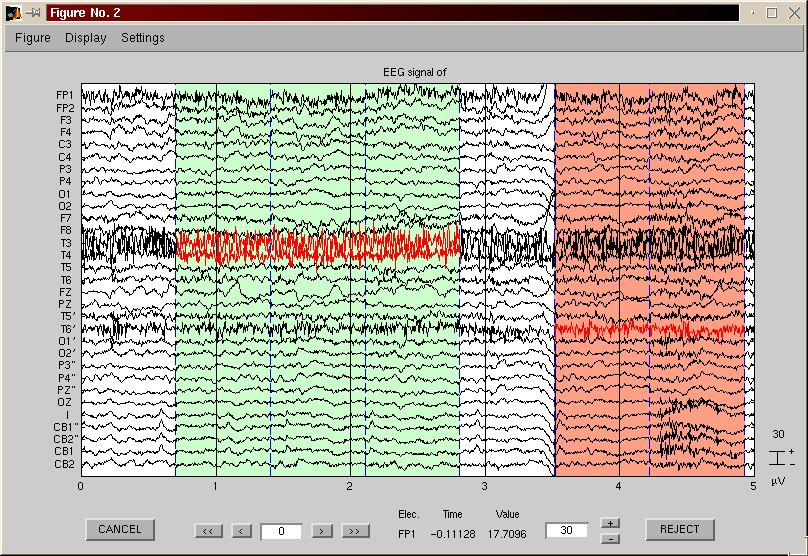
Plot the raw data and interactivelly reject trials and electrodes - menu tools - manual rejection
First run infomax ICA (menu TOOLS, INFOMAX ICA).
When finished, you might save your data (menu FILE, SAVE DATASET) for future use.
Several trials rejection menu function are available (if you
don't understand the fields that are proposed to you, just let the defaults)
These are not based on ICA
Manual trial reject - use eegplot to reject trials manually
Standard trial reject - thresholding over periods of time
Statistical trial reject - for comparison with component
These are based on ICA
Manual component reject - use eegplot to reject component on specific
trials manually
Standard component reject - for comparison with raw data
Statistical component reject - use entropy and kurtosis to select "odd"
trials.
Global component rejection
This is to reject whole independant component (subtract them
from the data). plot all the component map. It implement automatic rejection
based on their statistic. Also usefull to visualize components characteristics.
Rejection synthesis - combine standard, local compoenent rejection and
global component rejection (all the previous rejections).
TIP: when computing a rejection, always accept it. It won't erase
any of the original data and the information will be used for reejection
synthesis.