To further explore possible differences in brain dynamics accompanying the use of an egocentric or an allocentric reference frame we reconstructed the sources of brain activity during the tunnel task (Gramann et al., 2006, BrainRes). The current density reconstruction revealed the use of one or the other reference frame to be associated with distinct cortical activation patterns during critical stages of the task. For both strategy groups, an occipito-temporal network was dominantly active during the initial, straight tunnel segment (see A in Figure below). With turns in the tunnel (row B in Figure below), however, the activation patterns started to diverge, reflecting translational and/or rotational changes in the underlying coordinate systems. Computation of an egocentric reference frame was associated with prevailing activity within a posterior parietal-premotor network, with additional activity in frontal areas. In contrast, computation of an allocentric reference frame was associated with dominant activity within an occipito-temporal network, confirming right-temporal structures to play a crucial role for an allocentric representation of space.
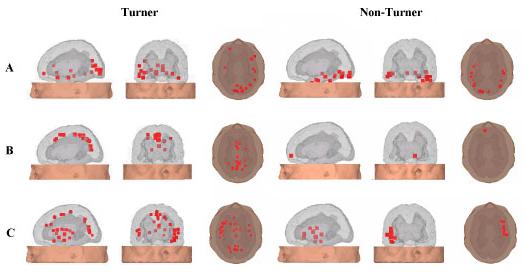
The figures display all reconstructed clusters exhibiting 75% of the maximum source activity, for 60% of the participants in a strategy group. Further investigations with patients with parietal lesions revealed the important role of the parietal cortex in encoding and recoding egocentric spatial information for further allocentric processing (Seubert, J., Humphreys, G., & Gramann, K., 2009, Neurocase).
Currently, we are working on new methods to analyse the continuous EEG-data by means of ICA and spectral analyses (Gramann et al., 2009, Journal of Cognitive Neuroscience), replicating differences in human brain dynamics accompanying the use of distinct frames of references. Overall 35 spatially distinct clusters were derived with only 5 clusters revealing significant differences in brain dynamics between Nonturners and Turners. These clusters were located in or near the primary visual cortex, the temporo-occipital cortex, bilateral inferior parietal cortex, and the retrosplenial cortex. Using ICA on EEG data provides sufficient temporal information to investigate the time course of cognitive processing on a sub-second scale. In addition, ICA decomposes IC processes that can be localized with sufficient spatial resolution using equivalent dipole modelling.
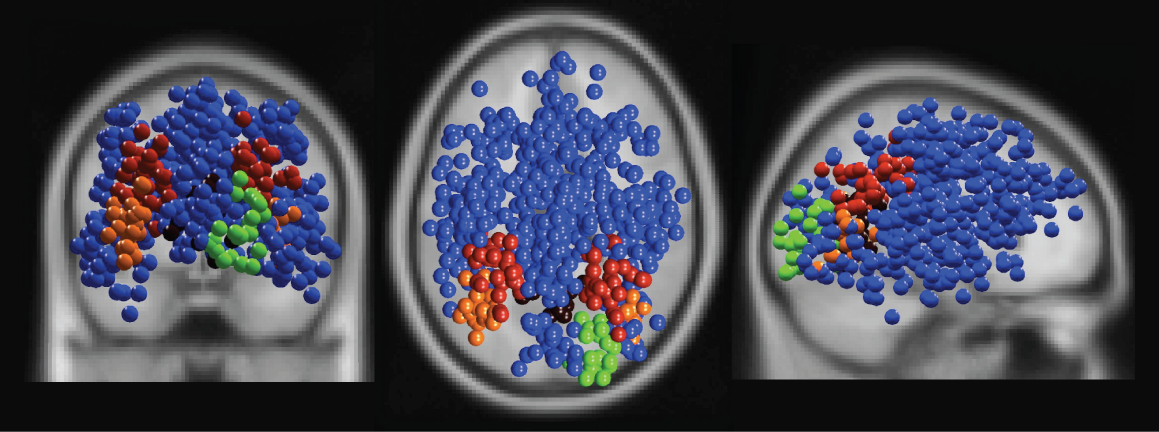
Figure 2: Equivalent model dipole locations for independent component clusters exhibiting and not-exhibiting ERSP differences between Turner and Nonturner subject groups. Blue balls show equivalent model dipole locations of independent component processes in 25 clusters without significant ERSP group differences; (green) cluster in or near right cuneus (Fig. 4B); (orange) cluster in or near bilateral inferior occipital gyrus (Fig. 4C), (red) cluster in or near left and right inferior parietal cortex (Fig. 4DE), (dark red) cluster in or near medial inferior retrosplenial cortex (Fig. 4F).
Besides differente independent frequency modes in extrastriate areas, the data revealed the retrosplenial cortex to differentiate between the use of an allocentric and an egocentric reference frame. The results support the notion that retrosplenial cortex serves as transition zone of egocentric information to an allocentric frame of reference. More importantly, we describe for the first time the sub-second dynamics of this recoding process. The following Figure displays independent component processes clustered with respect to the location of the reconstructed equivalent dipoles, their event-reltaed spectral perturbation, intertrial coherence, spectrum and scalp maps.
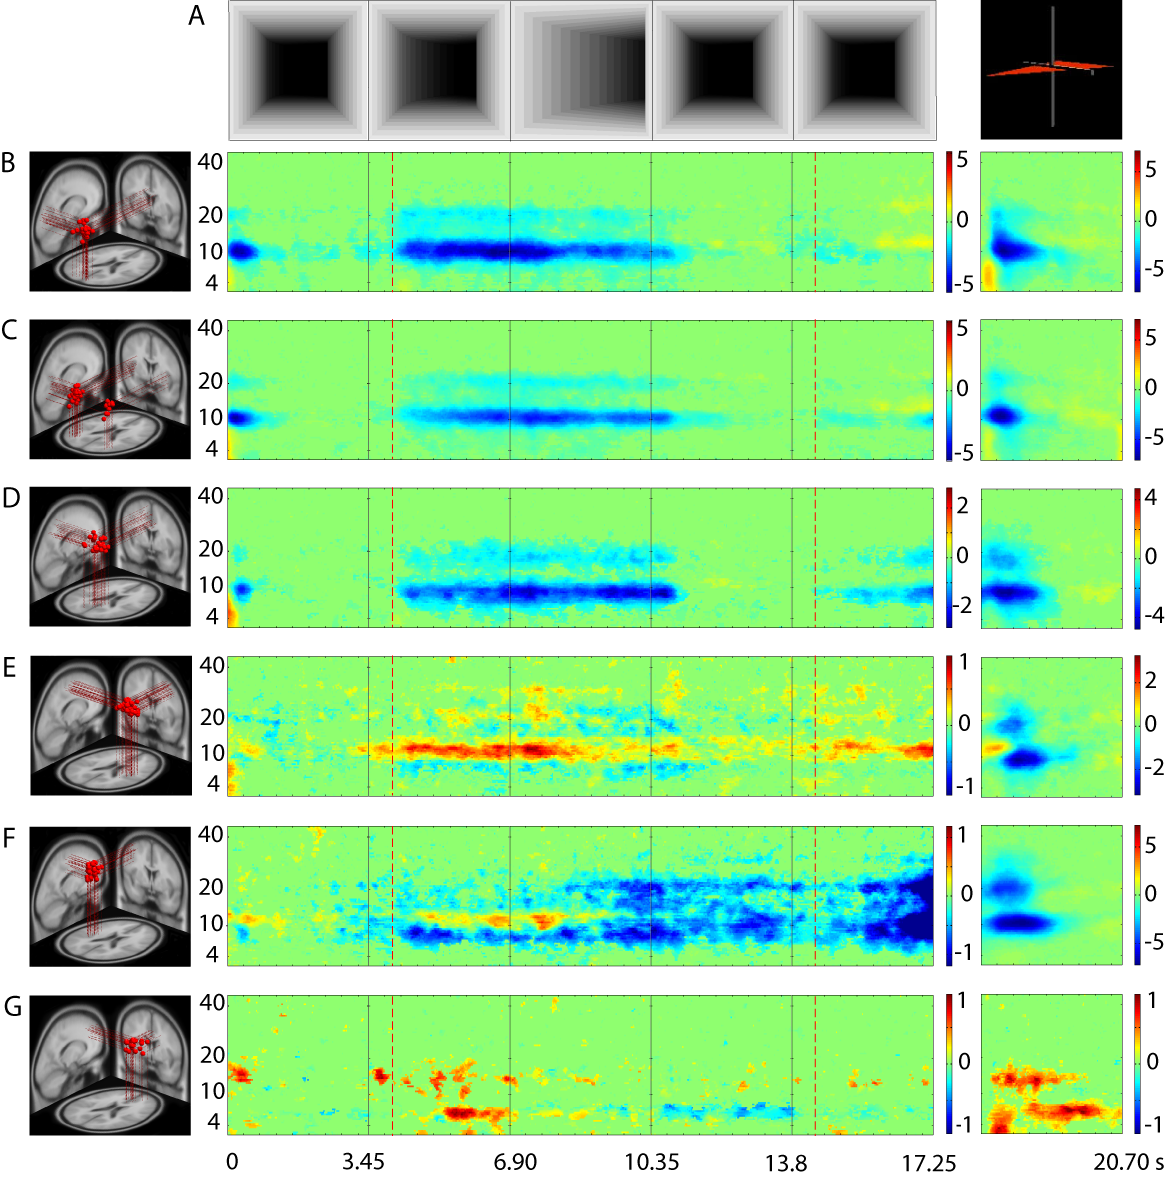
Figure 3: Mean
event-related spectral perturbations (ERSPs) for selected independent
component (IC) clusters during tunnel passages. Panel (A, left)
shows baseline mean log spectra during control trials removed from
the ERSPs of six selected IC clusters (B-G). Panels (A, middle)
show snapshots of a representative tunnel trial at five evenly-spaced
time points (spaced at intervals of 3450 ms) and (A, right) at
the appearance of the response prompt. Panels (B-G, left)
show locations of model equivalent dipoles for selected IC clusters,
projected into a standard brain space, with each red sphere
representing one cluster IC (or one of two bilaterally
position-symmetric dipoles for cluster C). Panels (B-G,
middle) show mean ERSP images for each of the IC clusters,
revealing task-dependent changes in spectral power during navigation
at log-spaced frequencies from 3 Hz to 45 Hz. Green indicates no
significant difference in mean log power from baseline (visual
stimulation during straight segments of the control trials). Other
colors show significant deviations in log power (dB) from baseline
(see color bars for scales). Vertical dashed orange lines indicate
onset and offset of the period in which participants perceived the
approaching and then (from 6.9 s) currently occurring tunnel turn.
Vertical dashed red lines indicate the period during which subjects
saw the tunnel exit approaching. (B) IC cluster 23 (22 ICs
from 12 Turners and 9 Nonturners), with the centroid located in or
near right cuneus (BA 18; x = -1, y = -79, z = 7; ); (C) IC
cluster 21 (24 ICs from 11 Turners, 8 Nonturners), in or near
bilateral inferior occipital gyrus at the border to the temporal lobe
(BA19/37; x = 37, y = -70, z = -1); (D) IC cluster 17 (26 ICs,
9 Turners, 10 Nonturners) in or near precuneus (BA 7; x = 0, y = -45,
z = 43); (E) IC cluster 12 (45 ICs, 12 Turners, 11 Nonturners)
in or near the right precentral gyrus (BA 4; x = 36, y = -12, z =
49); (F) IC cluster 8 (26 ICs, 7 Turners, 8 Nonturners) in or
near the left precentral gyrus (BA 4; x = -40, y = -13, z = 44); (G)
IC
cluster
1 (24 ICs, 13 Turners, 9 Nonturners) in or near the right
medial frontal gyrus (BA 9; x = 2, y = 41, z = 26). See Supplemental
Figures 1-6 for a description of all IC clusters.
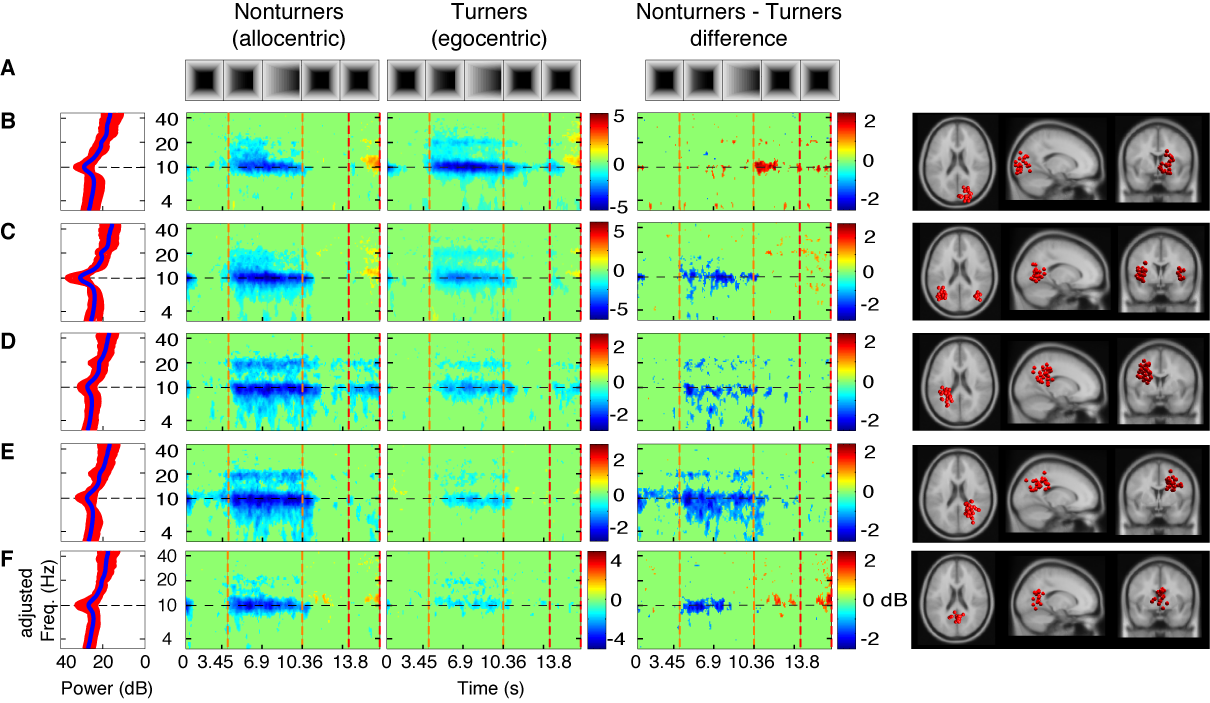
Figure: Component
clusters
revealing
significant differences for the use of an
egocentric or an allocentric reference frame during spatial
navigation. Top row (A) displays the time course of a
representative tunnel trial with five segments for Nonturners, using
an allocentric reference frame, for Turners, using an egocentric
reference frame, and for the difference ERSPs (computed by
subtracting ERSP activity of Turners from ERSP activity o
Nonturners). Rows B to F display from the left to the
most right column frequency-rescaled i) baseline power spectrum of
control trials, ii) ERSP activity for Nonturners, iii) ERSP activity
for Turners, iv) difference ERSPs computed by subtracting ERSP
activity of Turners from ERSP activity of Nonturners, and v) cluster
IC equivalent dipoles projected on horizontal, sagittal, and coronal
view of the standard brain for (B) a component cluster with
the cluster centroid located in or near the right inferior occipital
gyrus (x = -37, y = -70, z = -1), (C) a component cluster in
or near bilateral inferior occipital gyrus at the border to the
temporal lobe (BA19/37; x = 37, y = -67, z = -1), (D) a
component cluster located in or near left inferior parietal lobule
(BA 40; x = -30, y = -40, z = 33), (E) a component cluster
located in or near the right precuneus (x = 26, y = -47, z = 32), and
(F) a component cluster located in or near the retrosplenial
cortex at the posterior pole of the cingulate cortex (x = 1, y = -56,
z = 10). Color coding and dashed vertical lines as in Figure 2.
Our results demonstrate that advanced
EEG-based
functional
brain imaging using ICA-derived spatial filtering can be used to
study network dynamics of spatial orienting and navigation. Using
data-driven ICA spatial filtering on high-density EEG data and
equivalent-dipole modeling of IC source locations, we are able to
describe the task- and strategy-dependent modulation of several
frequency bands underlying computation and maintenance of distinct
reference frames on a sub-second time scale. Also, our results show
that future behavioral and brain imaging studies of human navigation
should take into account individual subject differences in navigation
approach and strategy. Our results support our conclusion that
preferred use of an egocentric or an allocentric reference frame
during spatial navigation is accompanied by differences in EEG brain
dynamics in cortical areas involved in integrating visual flow
information with changes in cognitive heading, and in areas
associated with the transfer of egocentrically experienced spatial
information into an allocentric reference frame.
Link to all reconstructed IC clusters for the above described experiment (Supplementary Material).
Link to the Tunnel paradigm.
Related Publications
Plank, M., Onton, J., Mueller, H.J., Makeig, S., & Gramann, K. (2010). Human EEG correlates of egocentric and allocentric path integration. Lecture Notes in Computer Science (forthcoming).
Gramann, K., Onton, J., Riccobon, D., Müller, H.J., Bardins, S., & Makeig, S. (2010). Human brain dynamics accompanying use of egocentric and allocentric referene frames during navigation. Journal of Cognitive Neuroscience (forthcoming).
Gramann, K., el Sharkawy, J. & Deubel, H. (2009). Eye-movements during navigation in a virtual tunnel. International Journal of Neuroscience, 119(10), 1755-1778.
Plank, M., Müller, H.J., Onton, J., Makeig, S., & Gramann, K. (2009). VR as promising tool for experimental research on human spatial navigation. In: S. Welke, H. Kolrep, & M. Roetting (Eds.), Biophysiologische Interfaces in der Mensch-Maschine-Interaktion, Fortschritt-Berichte VDI, 50-62.
Duann, J.R., Gramann, K., Chiou, T.C., Lin, T.C., Ko, L.W., & Yang, F.S. (2009). EEG-based spatial navigation estimation in a virtual reality driving environment. Proceedings of the Ninth IEEE International Conference on Bioinformatics and Bioengeneering, 435-438.
Seubert, J., Humphreys, G., Müller, H.J., & Gramann, K. (2008). Straight after the turn: the role of the parietal lobes for egocentric space processing. Neurocase, 4(2), 204-219.
Gramann, K., Müller, H.J., Schönebeck, B. & Debus, G. (2006). The neural basis of egocentric and allocentric reference frames in spatial navigation: Evidence from spatio-temporal coupled current density reconstruction. Brain Research, 1118, 116-129.
Gramann, K., Müller, H.J., Eick, E. & Schönebeck, B. (2005). Evidence of separable spatial representations in a virtual navigation task. Journal of Experimental Psychology: Human Perception and Performance, 31, 1199-1223.
Supporting Grants
German Research Foundation (DFG) Grant KG2627/2-1
Strategien räumlicher Orientierung: neuroanatomische und elektrokortikale Grundlagen ego- und allozentrischer Referenzsysteme
G.A.- Lienert Foundation
Link to current work in progress using the Tunnel paradigm.
Link to Tunnel program (zip file) and instruction how to install the program.
Department Psychology, Ludwig-Maximilians-University Munich
Swartz Center for Computational Neuroscience, UCSD