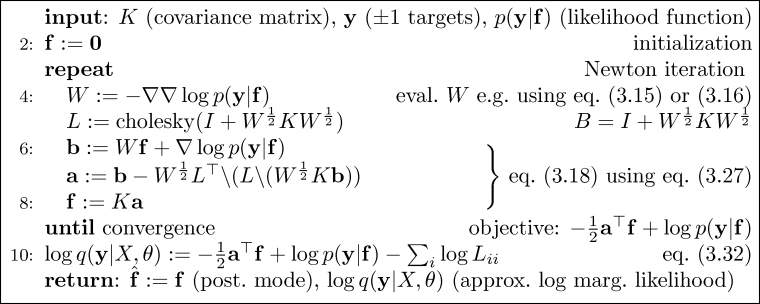
It is straight forward to implement Laplace's method for binary Gaussian process classification using matlab. Here we discuss an implementation which relies closely on Algorithm 3.1 (p. 46) for computing Laplace's approximation to the posterior, Algorithm 3.2 (p. 47) for making probabilistic predictions for test cases and Algorithm 5.1 (p. 126) for computing partial derivatives of the log marginal likelihood w.r.t. the hyperparameters (the parameters of the covariance function). Be aware that the negative of the log marginal likelihood is used.
The implementation given in binaryLaplaceGP.m can conveniently be used together with minimize.m. The program can do one of two things:
[nlml dnlml] = binaryLaplaceGP(logtheta, covfunc, lik, x, y)which is used when "training" the hyperparameters, or
[p mu s2 nlml] = binaryLaplaceGP(logtheta, covfunc, lik, x, y, xstar)
| inputs | |
| logtheta | a (column) vector containing the logarithm of the hyperparameters |
| covfunc | the covariance function, see covFunctions.m |
| lik | the likelihood function, built-in functions are: logistic and cumGauss. |
| x | a n by D matrix of training inputs |
| y | a (column) vector (of length n) of training set +1/-1 binary targets |
| xstar | (optional) a nn by D matrix of test inputs |
| outputs | |
| nlml | the negative log marginal likelihood |
| dnlml | (column) vector with the partial derivatives of the negative log marginal likelihood wrt. the logarithm of the hyperparameters. |
| mu | (column) vector (of length nn) of predictive latent means |
| s2 | (column) vector (of length nn) of predictive latent variances |
| p | (column) vector (of length nn) of predictive probabilities |
The iterations are terminated when the improvement in log marginal likelihood drops below a small tolerance. During the iterations, it is checked that the log marginal likelihood never decreases; if this happens bisection is repeatedly applied (up to a maximum of 10 times) until the likelihood increases.
What happens next depends on whether we are in the training or prediction mode, as indicated by the absence or presence of test inputs xstar. If test cases are present, then predictions are computed following Algorithm 3.2, section 3.4, page 47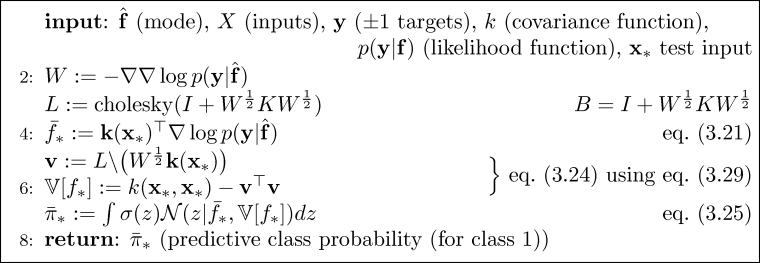
  n1=80; n2=40;                         % number of data points from each class
  S1 = eye(2); S2 = [1 0.95; 0.95 1];             % the two covariance matrices
  m1 = [0.75; 0]; m2 = [-0.75; 0];                              % the two means

  randn('seed',17)
  x1 = chol(S1)'*randn(2,n1)+repmat(m1,1,n1);          % samples from one class
  x2 = chol(S2)'*randn(2,n2)+repmat(m2,1,n2);              % and from the other

  x = [x1 x2]';                                      % these are the inputs and
  y = [repmat(-1,1,n1) repmat(1,1,n2)]';         % outputs used a training data
Below the samples are show together with the "Bayes Decision Probabilities",
obtained from complete knowledge of the data generating process:
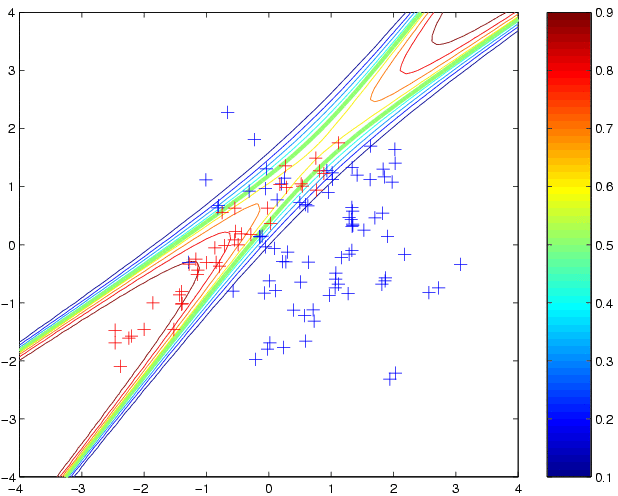
  [t1 t2] = meshgrid(-4:0.1:4,-4:0.1:4);
  t = [t1(:) t2(:)];                                % these are the test inputs

  tt = sum((t-repmat(m1',length(t),1))*inv(S1).*(t-repmat(m1',length(t),1)),2);
  z1 = n1*exp(-tt/2)/sqrt(det(S1));
  tt = sum((t-repmat(m2',length(t),1))*inv(S2).*(t-repmat(m2',length(t),1)),2);
  z2 = n2*exp(-tt/2)/sqrt(det(S2));

  contour(t1,t2,reshape(z2./(z1+z2),size(t1)),[0.1:0.1:0.9]);
  hold on
  plot(x1(1,:),x1(2,:),'b+')
  plot(x2(1,:),x2(2,:),'r+')
Now, we will fit a probabilistic Gaussian process classifier to this data, using an implementation of Laplace's method. We must specify a covariance function and a likelihood function. First, we will try the squared exponential covariance function covSEiso. We must specify the parameters of the covariance function (hyperparameters). For the isotropic squared exponential covariance function there are two hyperparameters, the lengthscale (kernel width) and the magnitude. We need to specify values for these hyperparameters (see below for how to learn them). Initially, we will simply set the log of these hyperparameters to zero, and see what happens. For the likelihood function, we use the cumulative Gaussian:
  loghyper = [0; 0];
  p2 = binaryLaplaceGP(loghyper, 'covSEiso', 'cumGauss', x, y, t);
  clf
  contour(t1,t2,reshape(p2,size(t1)),[0.1:0.1:0.9]);
  hold on
  plot(x1(1,:),x1(2,:),'b+')
  plot(x2(1,:),x2(2,:),'r+')
to produce predictive probabilities on the grid of test points:
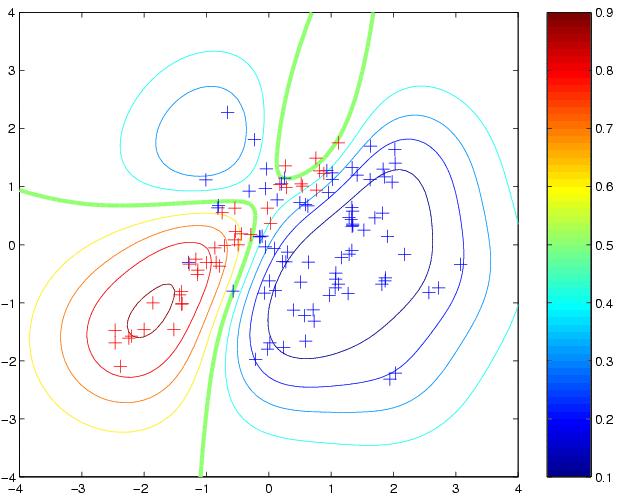
  newloghyper = minimize(loghyper, 'binaryLaplaceGP', -20, 'covSEiso', 'cumGauss', x, y)
  p3 = binaryLaplaceGP(newloghyper, 'covSEiso', 'cumGauss', x, y, t);
where the argument -20 tells minimize to evaluate the function at most 20 times. The new hyperparameters have a fairly similar length scale, but a much larger magnitude for the latent function. This leads to more extreme predictive probabilities:
  clf
  contour(t1,t2,reshape(p3,size(t1)),[0.1:0.1:0.9]);
  hold on
  plot(x1(1,:),x1(2,:),'b+')
  plot(x2(1,:),x2(2,:),'r+')
produces:

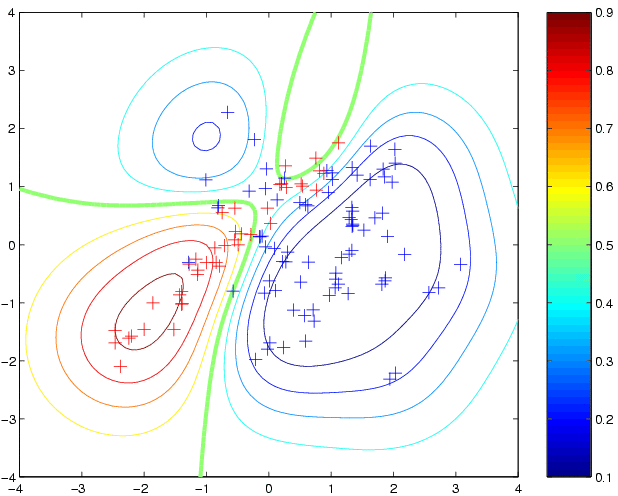
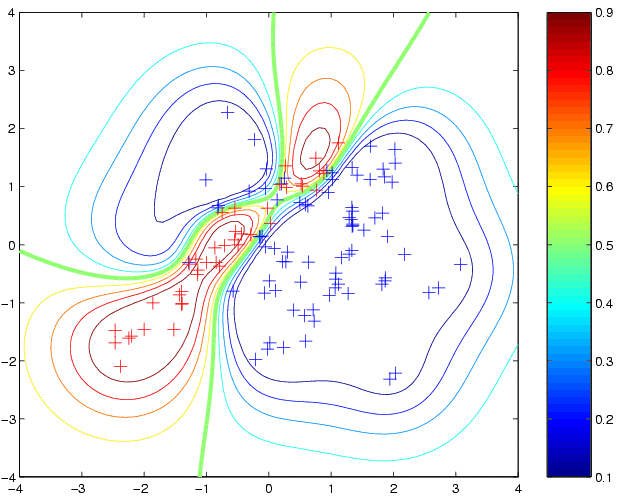
  newloghyper = minimize(loghyper, 'binaryLaplaceGP',-20,'covNNiso','cumGauss',x,y);
  p4 = binaryLaplaceGP(newloghyper, 'covNNiso','cumGauss', x, y, t);
  clf
  contour(t1,t2,reshape(p4,size(t1)),[0.1:0.1:0.9]);
  hold on
  plot(x1(1,:),x1(2,:),'b+')
  plot(x2(1,:),x2(2,:),'r+')
to produce:
[x y xx yy] = loadBinaryUSPS(3,5);which will create the training inputs x (of size 767 by 256), binary (+1/-1) training targets y (of length 767), and xx and yy containing the test set (of size 773). Use e.g. imagesc(reshape(x(3,:),16,16)'); to view an image (here the 3rd image of the training set). Now, let us make predictions using the squared exponential covariance function covSEiso and the cumulative Gaussian likelihood function cumGauss. We must specify the parameters of the covariance function (hyperparameters). For the isotropic squared exponential covariance function there are two hyperparameters, the characteristic length-scale (kernel width) and the signal magnitude. We need to specify values for these hyperparameters (see below for how to learn them). One strategy, which is perhaps not too unreasonable would be to set the characteristic length-scale to be equal to the average pair-wise distance between points, which for this data is around 22; the signal variance can be set to unity, since this is the range at which the sigmoid non-linearity comes into play. Other strategies for setting initial guesses for the hyperparameters may be reasonable as well. We need to specify the logarithm of the hypers, roughly log(22)=3 and log(1)=0:
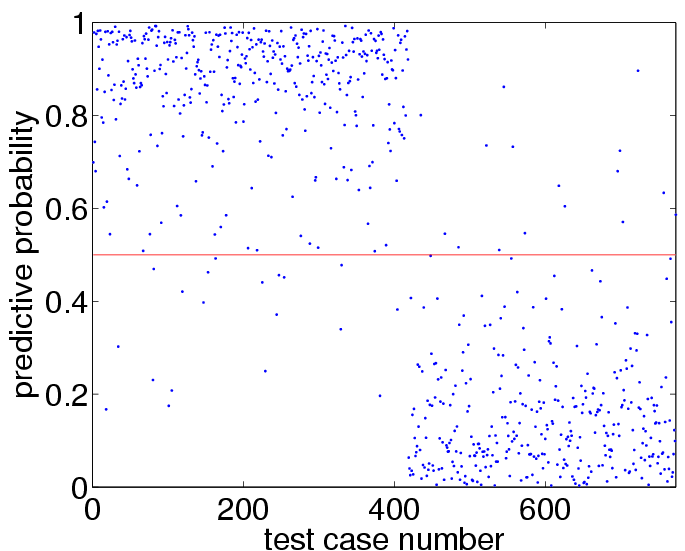
  loghyper = [3.0; 0.0];   % set the log hyperparameters
  p = binaryLaplaceGP(loghyper, 'covSEiso', 'cumGauss', x, y, xx);
which may take a few seconds to compute. We can visualize the predictive test set probabilities using:
  plot(p,'.')
  hold on
  plot([1 length(p)],[0.5 0.5],'r')
to get:
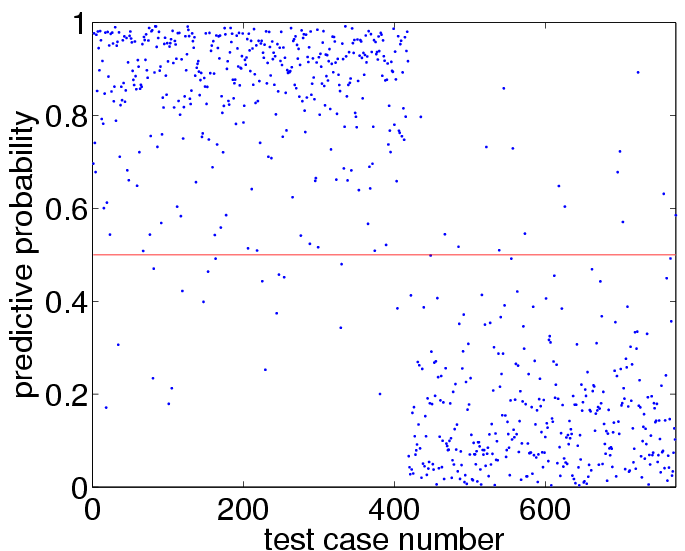
  sum((p>0.5)~=(yy>0))
  mean((yy==1).*log2(p)+(yy==-1).*log2(1-p))+1
which shows test set 35 prediction errors (out of 773 test cases) and an average amount of information of about 0.71 bits, compare to Figure 3.7(b) and 3.7(d) on page 64. More interestingly, we can also use the program to find the values for the hyperparameters which optimize the marginal likelihood, as follows:
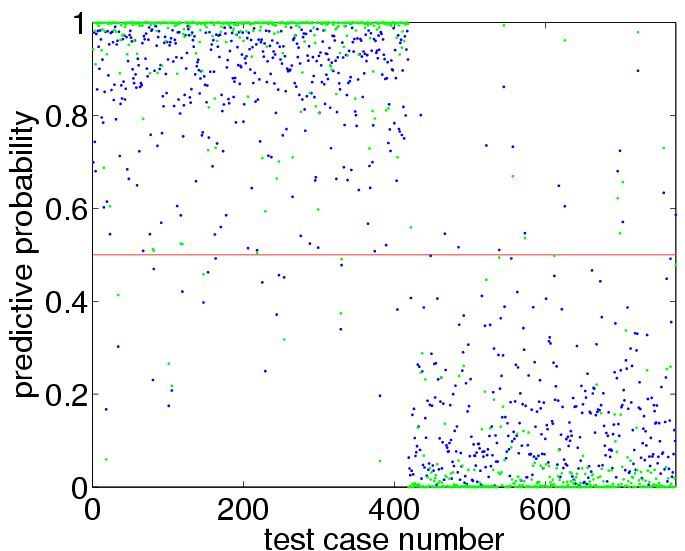
  [loghyper' binaryLaplaceGP(loghyper, 'covSEiso', 'cumGauss', x, y)]
  [newloghyper logmarglik] = minimize(loghyper, 'binaryLaplaceGP', -20, 'covSEiso', 'cumGauss', x, y);
  [newloghyper' logmarglik(end)]
where the third argument -20 to the minimize function, tells minimize to evaluate the function at most 20 times (this is adequate when the parameter space is only 2-dimensional. Above, we first evaluate the negative log marginal likelihood at our initial guess for loghyper (which is about 222), then minimize the negative log marginal likelihood w.r.t. the hyperparameters, to obtain new values of 2.75 for the log lengthscale and 2.27 for the log magnitude. The negative log marginal likelihood decreases to about 99 at the minimum, see also Figure 3.7(a) page 64. The marginal likelihood has thus increased by a factor of exp(222-99) or roughly 3e+53. Finally, we can make test set predictions with the new hyperparameters:
  pp = binaryLaplaceGP(newloghyper, 'covSEiso', 'cumGauss', x, y, xx);
  plot(pp,'g.')
to obtain:
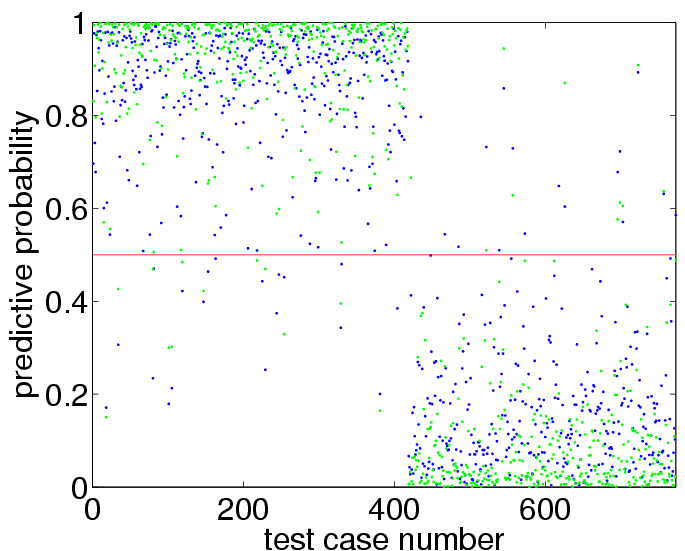
  sum((pp>0.5)~=(yy>0))
  mean((yy==1).*log2(pp)+(yy==-1).*log2(1-pp))+1
reveals that there are now 22 test set misclassifications (as opposed to 35) and the information about the test set labels has increased from 0.71 bits to 0.83 bits.
It is straight forward to implement the Expectation Propagation (EP) algorithm for binary Gaussian process classification using matlab. Here we discuss an implementation which relies closely on Algorithm 3.5 (p. 58) for computing the EP approximation to the posterior, Algorithm 3.6 (p. 59) for making probabilistic predictions for test cases and Algorithm 5.2 (p. 127) for computing partial derivatives of the log marginal likelihood w.r.t. the hyperparameters (the parameters of the covariance function). Be aware that the negative of the log marginal likelihood is used.
The implementation given in binaryEPGP.m can conveniently be used together with minimize.m. The program can do one of two things:
[nlml dnlml] = binaryEPGP(logtheta, covfunc, x, y)which is used when "training" the hyperparameters, or
[p mu s2 nlml] = binaryEPGP(logtheta, cov, x, y, xstar)
| inputs | |
| logtheta | a (column) vector containing the logarithm of the hyperparameters |
| covfunc | the covariance function, see covFunctions.m |
| x | a n by D matrix of training inputs |
| y | a (column) vector (of length n) of training set +1/-1 binary targets |
| xstar | (optional) a nn by D matrix of test inputs |
| outputs | |
| nlml | the negative log marginal likelihood |
| dnlml | (column) vector with the partial derivatives of the negative log marginal likelihood wrt. the logarithm of the hyperparameters. |
| mu | (column) vector (of length nn) of predictive latent means |
| s2 | (column) vector (of length nn) of predictive latent variances |
| p | (column) vector (of length nn) of predictive probabilities |
  n1=80; n2=40;                         % number of data points from each class
  randn('seed',17)

  S1 = eye(2); S2 = [1 0.95; 0.95 1];             % the two covariance matrices
  m1 = [0.75; 0]; m2 = [-0.75; 0];                              % the two means

  x1 = chol(S1)'*randn(2,n1)+repmat(m1,1,n1);          % samples from one class
  x2 = chol(S2)'*randn(2,n2)+repmat(m2,1,n2);              % and from the other

  x = [x1 x2]';                                      % these are the inputs and
  y = [repmat(-1,1,n1) repmat(1,1,n2)]';         % outputs used a training data
Below the samples are show together with the "Bayes Decision Probabilities",
obtained from complete knowledge of the data generating process:
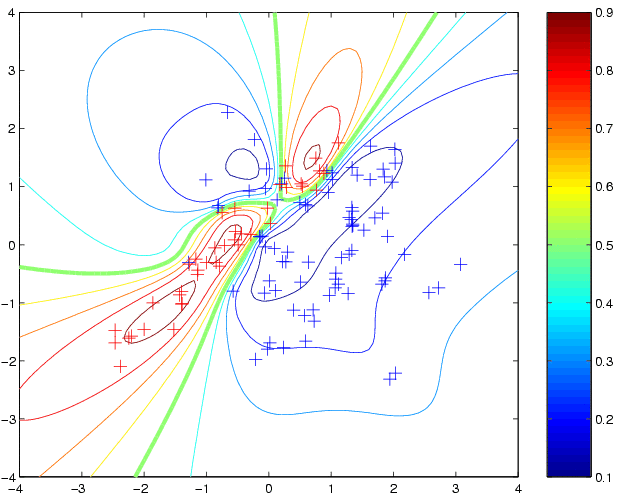
  [t1 t2] = meshgrid(-4:0.1:4,-4:0.1:4);
  t = [t1(:) t2(:)];                                % these are the test inputs

  tt = sum((t-repmat(m1',length(t),1))*inv(S1).*(t-repmat(m1',length(t),1)),2);
  z1 = n1*exp(-tt/2)/sqrt(det(S1));
  tt = sum((t-repmat(m2',length(t),1))*inv(S2).*(t-repmat(m2',length(t),1)),2);
  z2 = n2*exp(-tt/2)/sqrt(det(S2));

  contour(t1,t2,reshape(z2./(z1+z2),size(t1)),[0.1:0.1:0.9]);
  hold on
  plot(x1(1,:),x1(2,:),'b+')
  plot(x2(1,:),x2(2,:),'r+')
Now, we will fit a probabilistic Gaussian process classifier to this data, using an implementation of the Expectation Propagation (EP) algorithm. We must specify a covariance function. First, we will try the squared exponential covariance function covSEiso. We must specify the parameters of the covariance function (hyperparameters). For the isotropic squared exponential covariance function there are two hyperparameters, the lengthscale (kernel width) and the magnitude. We need to specify values for these hyperparameters (see below for how to learn them). Initially, we will simply set the log of these hyperparameters to zero, and see what happens. For the likelihood function, we use the cumulative Gaussian:
  loghyper = [0; 0];
  p2 = binaryEPGP(loghyper, 'covSEiso', x, y, t);
  clf
  contour(t1,t2,reshape(p2,size(t1)),[0.1:0.1:0.9]);
  hold on
  plot(x1(1,:),x1(2,:),'b+')
  plot(x2(1,:),x2(2,:),'r+')
to produce predictive probabilities on the grid of test points:
  newloghyper = minimize(loghyper, 'binaryEPGP', -20, 'covSEiso', x, y)
  p3 = binaryEPGP(newloghyper, 'covSEiso', x, y, t);
where the argument -20 tells minimize to evaluate the function at most 20 times. The new hyperparameters have a fairly similar length scale, but a much larger magnitude for the latent function. This leads to more extreme predictive probabilities:
  clf
  contour(t1,t2,reshape(p3,size(t1)),[0.1:0.1:0.9]);
  hold on
  plot(x1(1,:),x1(2,:),'b+')
  plot(x2(1,:),x2(2,:),'r+')
produces:
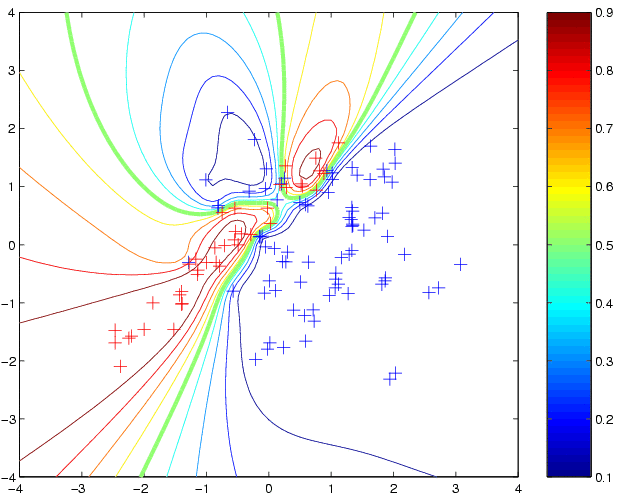
  newloghyper = minimize(loghyper, 'binaryEPGP', -20, 'covNN', x, y);
  p4 = binaryEPGP(newloghyper, 'covNN', x, y, t);
  clf
  contour(t1,t2,reshape(p4,size(t1)),[0.1:0.1:0.9]);
  hold on
  plot(x1(1,:),x1(2,:),'b+')
  plot(x2(1,:),x2(2,:),'r+')
to produce:
  cd gpml-demo                      % you need to be in the gpml-demo directory
  cd ..; w=pwd; addpath([w,'/gpml']); cd gpml-demo  % add the path for the code
  [x y xx yy] = loadBinaryUSPS(3,5);
which will create the training inputs x (of size 767 by 256), binary (+1/-1) training targets y (of length 767), and xx and yy containing the test set (of size 773). Use e.g. imagesc(reshape(x(3,:),16,16)'); to view an image (here the 3rd image of the training set). Now, let us make predictions using the squared exponential covariance function covSEiso. We must specify the parameters of the covariance function (hyperparameters). For the isotropic squared exponential covariance function there are two hyperparameters, the lengthscale (kernel width) and the magnitude. We need to specify values for these hyperparameters (see below for how to learn them). One strategy, which is perhaps not too unreasonable would be to set the characteristic length-scale to be equal to the average pair-wise distance between points, which for this data is around 22; the signal variance can be set to unity, since this is the range at which the sigmoid non-linearity comes into play. Other strategies for setting initial guesses for the hyperparameters may be reasonable as well. We need to specify the logarithm of the hypers, roughly log(22)=3 and log(1)=0:
  loghyper = [3.0; 0.0];   % set the log hyperparameters
  p = binaryEPGP(loghyper, 'covSEiso', x, y, xx);
which may take a few minutes to compute. We can visualize the predictive probabilities for the test cases using:
  plot(p,'.')
  hold on
  plot([1 length(p)],[0.5 0.5],'r')
to get:
  sum((p>0.5)~=(yy>0))
  mean((yy==1).*log2(p)+(yy==-1).*log2(1-p))+1
which shows test set 35 prediction errors (out of 773 test cases) and an average amount of information of about 0.72 bits, compare to Figure 3.8(b) and 3.8(d) on page 65. More interestingly, we can also use the program to find the values for the hyperparameters which optimize the marginal likelihood, as follows:
  [loghyper' binaryEPGP(loghyper, 'covSEiso', x, y)]
  [newloghyper logmarglik] = minimize(loghyper, 'binaryEPGP', -20, 'covSEiso', x, y);
  [newloghyper' logmarglik(end)]
where the third argument -20 to the minimize function, tells minimize to evaluate the function at most 20 times (this is adequate when the parameter space is only 2-dimensional. Warning: the optimization above may take about an hour depending on your machine and whether you have compiled the mex files. If you don't want to wait that long, you can train on a subset of the data (but note that the cases are ordered according to class). Above, we first evaluate the negative log marginal likelihood at our initial guess for loghyper (which is about 222), then minimize the negative log marginal likelihood w.r.t. the hyperparameters, to obtain new values of 2.55 for the log lengthscale and 3.96 for the log magnitude. The negative log marginal likelihood decreases to about 90 at the minimum, see also Figure 3.8(a) page 65. The negative log marginal likelihood decreases to about 90 at the minimum, see also Figure 3.7(a) page 64. The marginal likelihood has thus increased by a factor of exp(222-90) or roughly 2e+57. Finally, we can make test set predictions with the new hyperparameters:
  pp = binaryEPGP(newloghyper, 'covSEiso', x, y, xx);
  plot(pp,'g.')
to obtain:
  sum((pp>0.5)~=(yy>0))
  mean((yy==1).*log2(pp)+(yy==-1).*log2(1-pp))+1
reveals that there are now 19 test set misclassifications (as opposed to 35) and the information about the test set labels has increased from 0.72 bits to 0.89 bits.