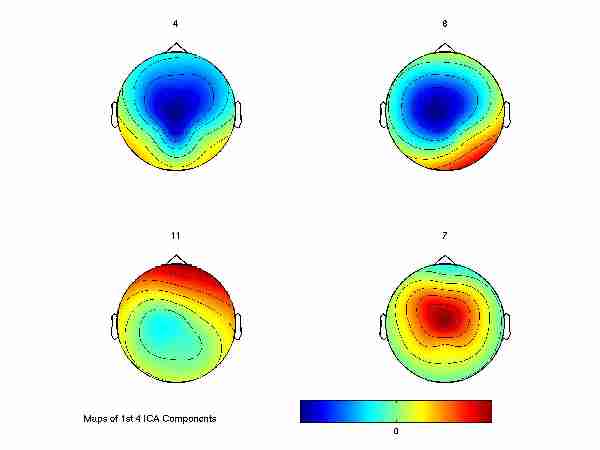
 compmap() - Plot multiple topoplot() maps of ICA component topographies
             Click on an individual map to view separately.

                                     Example
 Usage:
       >> compmap (winv,'eloc_file',compnos,'title',rowscols,labels,printflag)

 winv       Inverse weight matrix = EEG scalp maps. Each column is a
            map; the rows correspond to the electrode positions
            defined in the eloc_file. Normally, winv = inv(weights*sphere).
'eloc_file' Name of the eloctrode position file in the style defined
            by >> topoplot('example') {default|0 ->'chan_file'}
 compnos    Vector telling which (order of) component maps to show
            Indices <0 tell compmap to invert a map; = 0 leave blank subplot
            Example: [1 0 -2 3 0 -6] {default|0 -> 1:columns_in_winv}
'title'     Title string for each page {default|0 -> 'ICA Component Maps'}
 rowscols   Vector of the form [m,n] where m is total vertical tiles and n
            is horizontal tiles per page. If the number of maps exceeds m*n,
            multiple figures will be produced {def|0 -> one near-square page}.
 labels     Vector of numbers or a matrix of strings to use as labels for
            each map, else ' ' -> no labels {default|0 -> 1:ncolumns_in_winv}
 printflag  0 = screen-plot colors {default}
            1 = printer-plot colors

 Map scaling is to +/-max(abs(data); green = 0

                                                       Toolbox function list
Example
Usage:
>> compmap (winv,'eloc_file',compnos,'title',rowscols,labels,printflag)
winv Inverse weight matrix = EEG scalp maps. Each column is a
map; the rows correspond to the electrode positions
defined in the eloc_file. Normally, winv = inv(weights*sphere).
'eloc_file' Name of the eloctrode position file in the style defined
by >> topoplot('example') {default|0 ->'chan_file'}
compnos Vector telling which (order of) component maps to show
Indices <0 tell compmap to invert a map; = 0 leave blank subplot
Example: [1 0 -2 3 0 -6] {default|0 -> 1:columns_in_winv}
'title' Title string for each page {default|0 -> 'ICA Component Maps'}
rowscols Vector of the form [m,n] where m is total vertical tiles and n
is horizontal tiles per page. If the number of maps exceeds m*n,
multiple figures will be produced {def|0 -> one near-square page}.
labels Vector of numbers or a matrix of strings to use as labels for
each map, else ' ' -> no labels {default|0 -> 1:ncolumns_in_winv}
printflag 0 = screen-plot colors {default}
1 = printer-plot colors
Map scaling is to +/-max(abs(data); green = 0
Toolbox function list
) Example
Usage:
>> compmap (winv,'eloc_file',compnos,'title',rowscols,labels,printflag)
winv Inverse weight matrix = EEG scalp maps. Each column is a
map; the rows correspond to the electrode positions
defined in the eloc_file. Normally, winv = inv(weights*sphere).
'eloc_file' Name of the eloctrode position file in the style defined
by >> topoplot('example') {default|0 ->'chan_file'}
compnos Vector telling which (order of) component maps to show
Indices <0 tell compmap to invert a map; = 0 leave blank subplot
Example: [1 0 -2 3 0 -6] {default|0 -> 1:columns_in_winv}
'title' Title string for each page {default|0 -> 'ICA Component Maps'}
rowscols Vector of the form [m,n] where m is total vertical tiles and n
is horizontal tiles per page. If the number of maps exceeds m*n,
multiple figures will be produced {def|0 -> one near-square page}.
labels Vector of numbers or a matrix of strings to use as labels for
each map, else ' ' -> no labels {default|0 -> 1:ncolumns_in_winv}
printflag 0 = screen-plot colors {default}
1 = printer-plot colors
Map scaling is to +/-max(abs(data); green = 0
Toolbox function list
Example
Usage:
>> compmap (winv,'eloc_file',compnos,'title',rowscols,labels,printflag)
winv Inverse weight matrix = EEG scalp maps. Each column is a
map; the rows correspond to the electrode positions
defined in the eloc_file. Normally, winv = inv(weights*sphere).
'eloc_file' Name of the eloctrode position file in the style defined
by >> topoplot('example') {default|0 ->'chan_file'}
compnos Vector telling which (order of) component maps to show
Indices <0 tell compmap to invert a map; = 0 leave blank subplot
Example: [1 0 -2 3 0 -6] {default|0 -> 1:columns_in_winv}
'title' Title string for each page {default|0 -> 'ICA Component Maps'}
rowscols Vector of the form [m,n] where m is total vertical tiles and n
is horizontal tiles per page. If the number of maps exceeds m*n,
multiple figures will be produced {def|0 -> one near-square page}.
labels Vector of numbers or a matrix of strings to use as labels for
each map, else ' ' -> no labels {default|0 -> 1:ncolumns_in_winv}
printflag 0 = screen-plot colors {default}
1 = printer-plot colors
Map scaling is to +/-max(abs(data); green = 0
Toolbox function list