In a first series of experiments we showed that in visual search, there is a reaction time (RT) cost for targets on a given trial if the previous target was defined in a different dimension. According to the 'dimension-weighting account' (Muller, Heller, & Ziegler, 1995), limited attentional weight needs to be shifted to the new dimension, resulting in slower RTs. We aimed at identifying brain electrical correlates associated with the weight shift. Analyses of ERPs revealed several components to reflect dimension changes whether the task was to detect the target or to identify its defining dimension. N2 amplitudes were more negative whenever the dimension changed. The P3 exhibited latency differences that mirrored RTs in both tasks, but the amplitudes showed no direct relation to stimulus- or response-related processes. Finally, slow-wave amplitudes were enhanced for dimension changes. Taken together, the results provide support for relatively early, perceptual processes underlying dimension change costs (Gramann, Toellner, Krummenacher, Eimer & Muller (2007), Psychophysiology).
In a second experimental approach, we tried to dissociate perceptual and motoric influences on dimension-based weighting mechanisms. By focusing on the N2pc and the lateralized readines potential (LRP) we were able to demonstrate, that in cross-dimensional visual search tasks, target discrimination is expedited when the previous trial contained a target defined in the same visual dimension as the current trial. The DWA explains this RT-pattern by assuming that visual dimensions are weighted on a perceptual stage of processing. Recently, this view has been challenged by models in which the allocation of attentional resources is assumed to occur after visual encoding mechanisms (Mortier et al., 2005). To disentangle whether the intertrial facilitation effect is due to a “perceptual” stage, “response selection“ stage, or a combination of both stages, we recorded EEG during a compound task. Participants first had to search for a singleton target, defined by a unique dimension (colour or shape), before the appropriate response, which was independently determined by the orientation of the target, could be selected. Visual dimension repetitions were mirrored by shorter latencies and enhanced amplitudes of the N2pc suggesting a facilitated allocation of attentional resources to the actual target. Response repetitions and changes systematically modulated the LRP amplitude suggesting a benefit from residual activations of the previous trial biasing the correct response. Overall, the present findings strengthen the DWA indicating a perceptual origin of dimension change costs in visual search (Toellner, Gramann, Muller, Kiss & Eimer (2008), Journal of Experimental Psychology: Human Perception and Performance).
Lately, we focussed on the influence of dimensional weighting on early sensory processes as reflected in the visual evoked P1-component. The selection of targets in a visual scene can be based on positional information or non-spatial features operating in a location-independent manner. Here we investigated whether dimension-based attention effects (i) can be observed for early visual information processing and (ii) whether the number of possible target locations in visual search influences dimension based processes. To test this, a visual search task for singletons with non-predictive featural but predictive locational trial-by-trial cueing (Experiment 1), or non-predictive dimensional and non-predictive locational identity of the upcoming target (Experiment 2) was conducted. The results revealed systematic dimension-based variations of the early visual evoked P1 in both experiments.
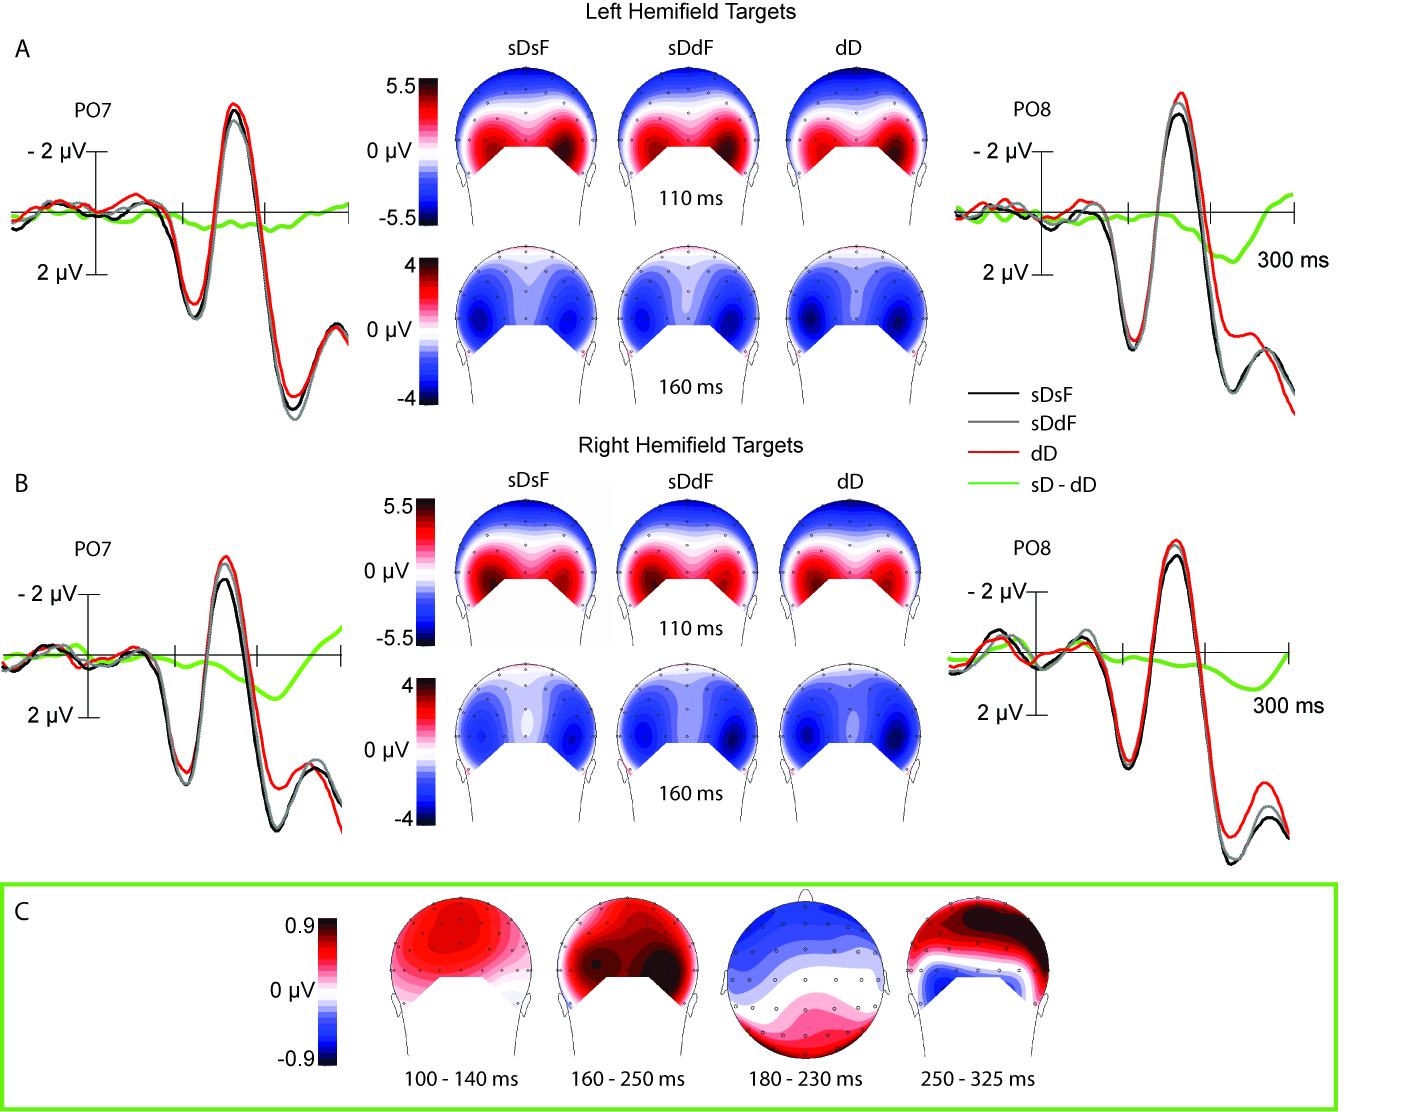
Figure 1: Grand-average ERP waveforms eklicited over early visual areas, recorded at electrode positions PO7/PO8 contra- and ipsilateral to (A) left hemifield targets and (B) right hemifield targets in a 300 ms intervall following stimulus onset. Black lines represent feature repetitions between the cue and target singletons (sDsF), dark grey lines intra-dimensional feature changes (sDdF), and red lines dimension changes (dD). The middle column displays scalp maps for the visual evoked P1 component (upper row) and the N1 component (lower row) for the 3 experimental conditions. (C) represents scalp maps for difference waveforms, computed by subtracting different dimension trials from same dimension trials. Scalp maps are displayed for 4 different time windows.
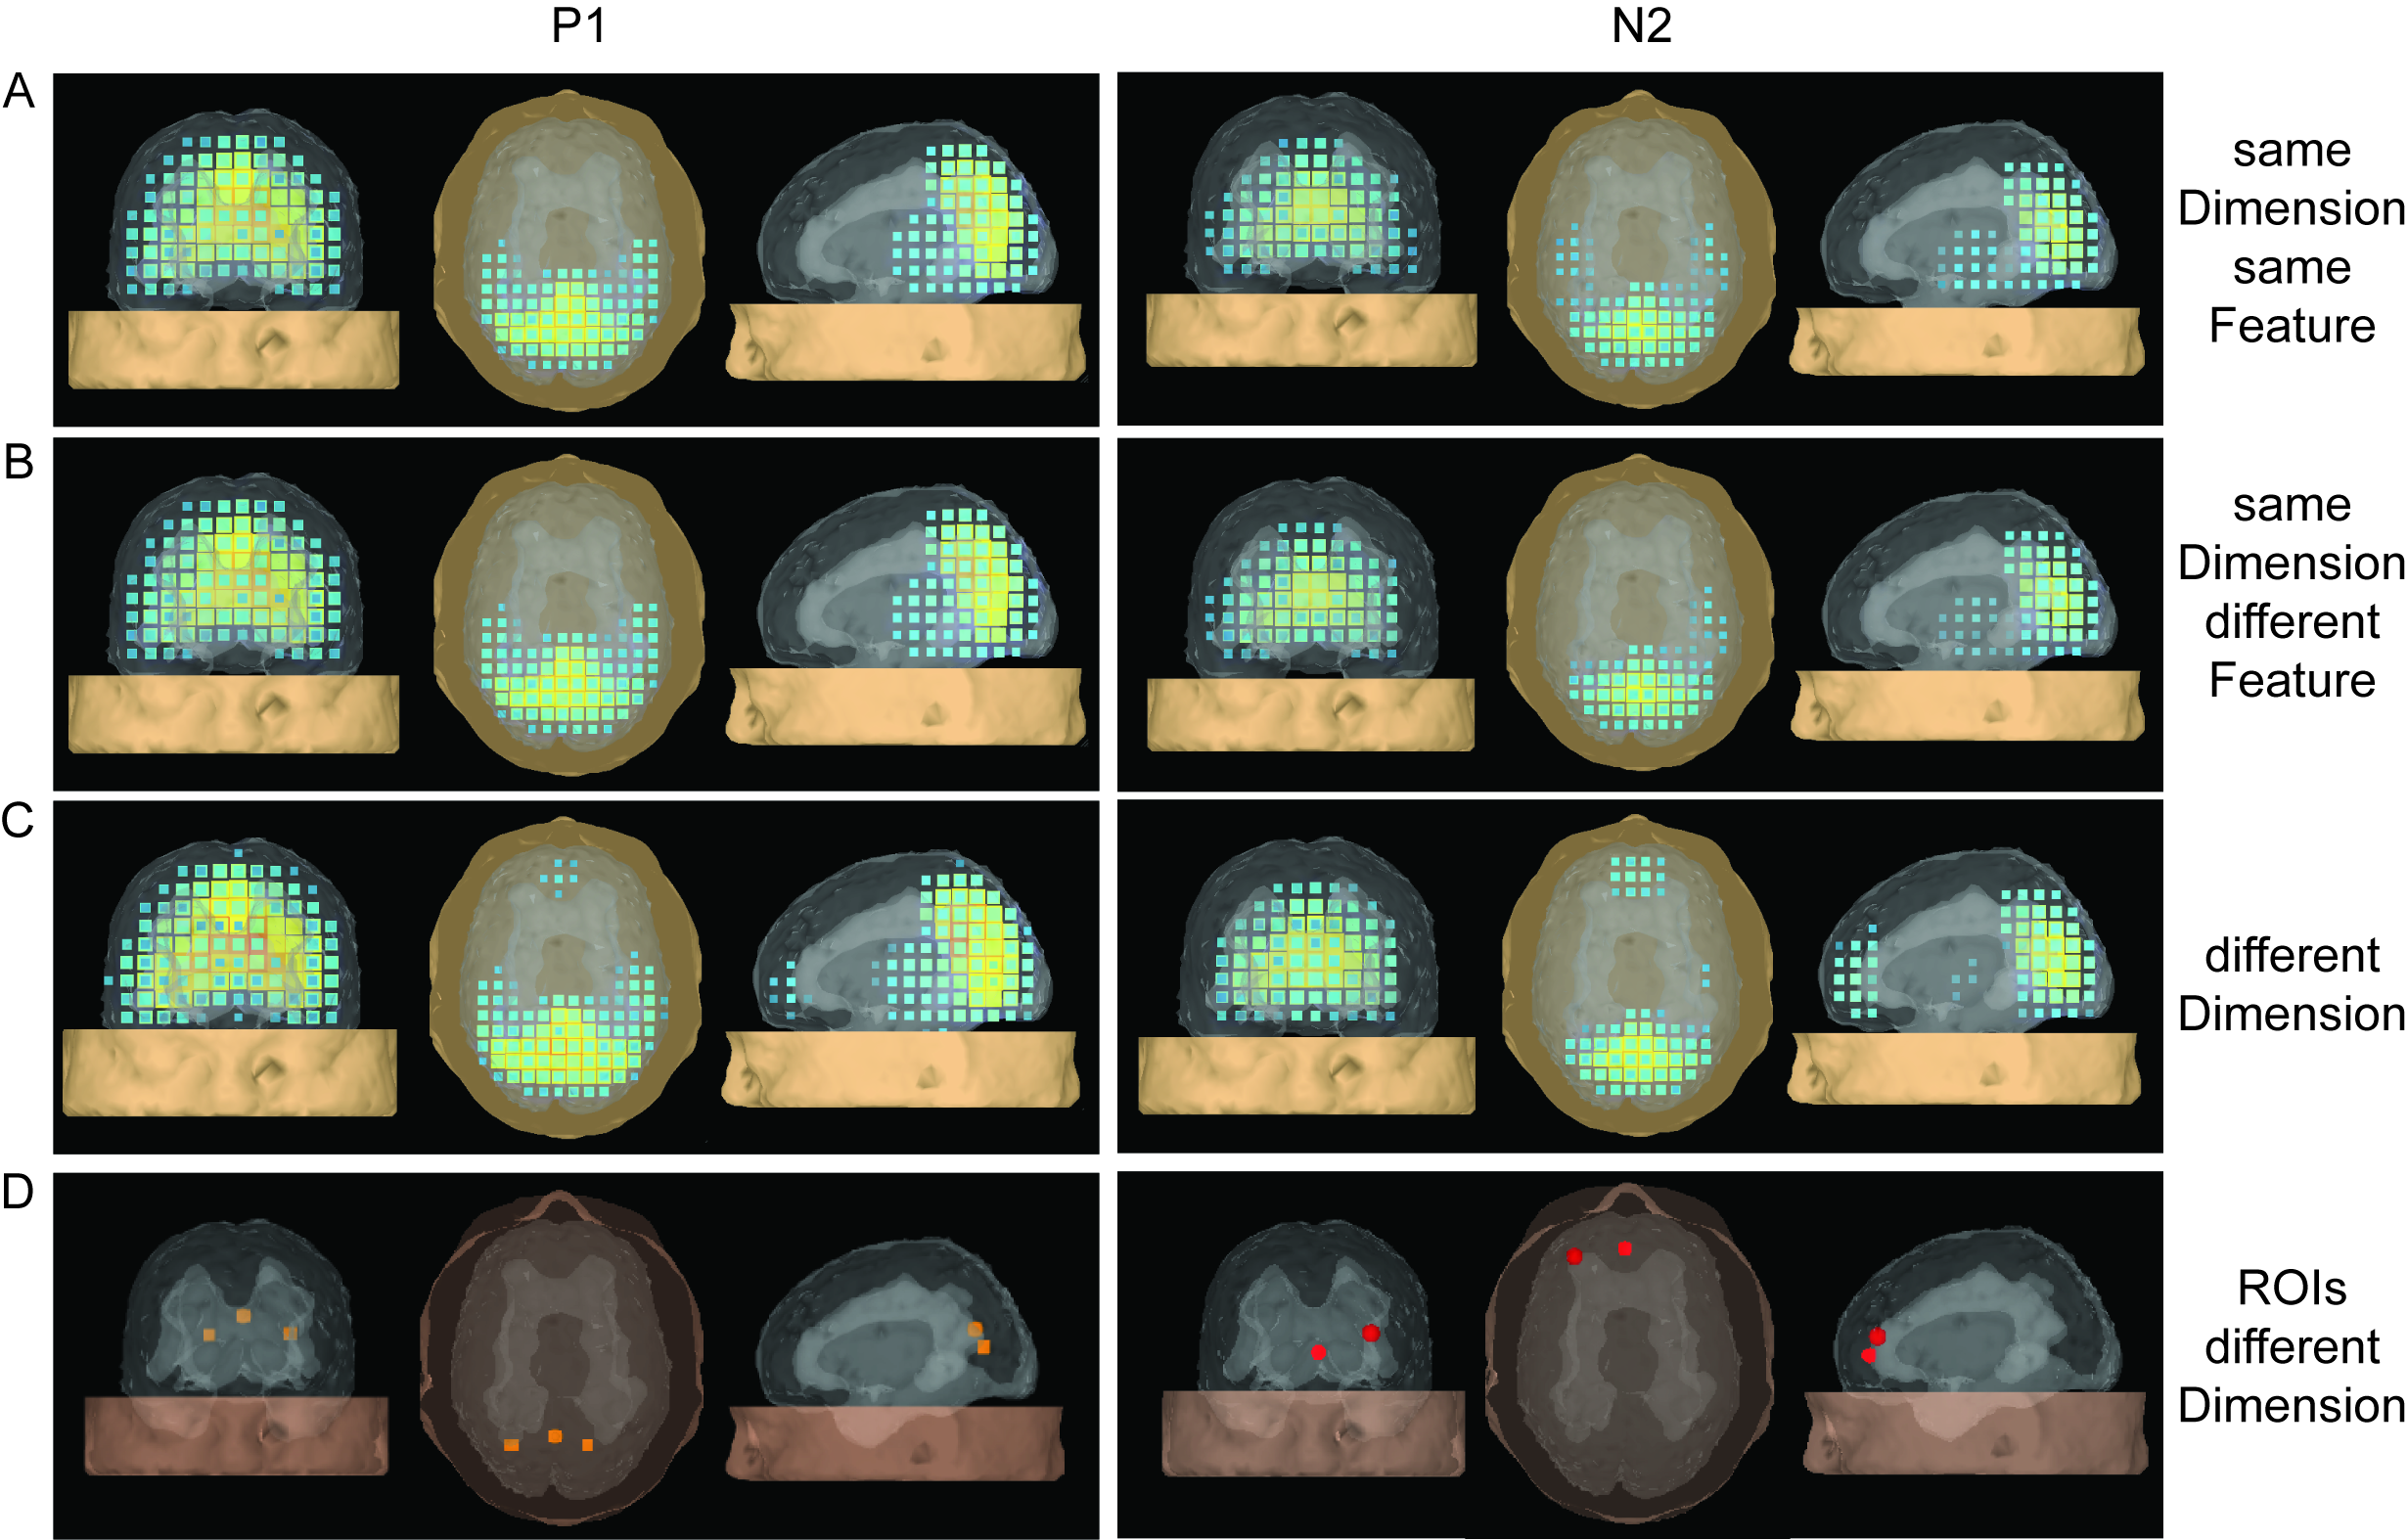
Figure 2: Spatio-temporal coupled density reconstruction for same- and different dimension trials. Left and right columns display current souorce activation for the visual P1 and tN2 component, for (a) same dimension same feature trials (sDsF), (B) same dimension diferent feature trials (sDdF), and (C) different dimension trials (dD). Last row (D) displays regions revealing significant dimension based modulations on source level.
This effect was independent of the featural identity within the cued dimension. In addition, the anterior transition N2 (tN2) was increased for dimension changes relative to repetitions. Based on these components, source reconstructions demonstrated dimension change-related activations in left frontopolar and dorsal occipital cortex. The dimension-based non-spatial influence on early visual processing is in line with dimension-based theories on visual attention (e.g. DWA) and provides evidence for the processing of dimensional information as early as 110 ms post-stimulus (Gramann, K., Toellner, T., & Muller, H., 2009, Psychophysiology).
Using a data-driven analysis approach, we extended the results and demonstrated a network of frontal independent component clusters to modulate the surface recorded activity (Onton, J., Toellner, T., Mueller, H., & Gramann, K., in preparation).
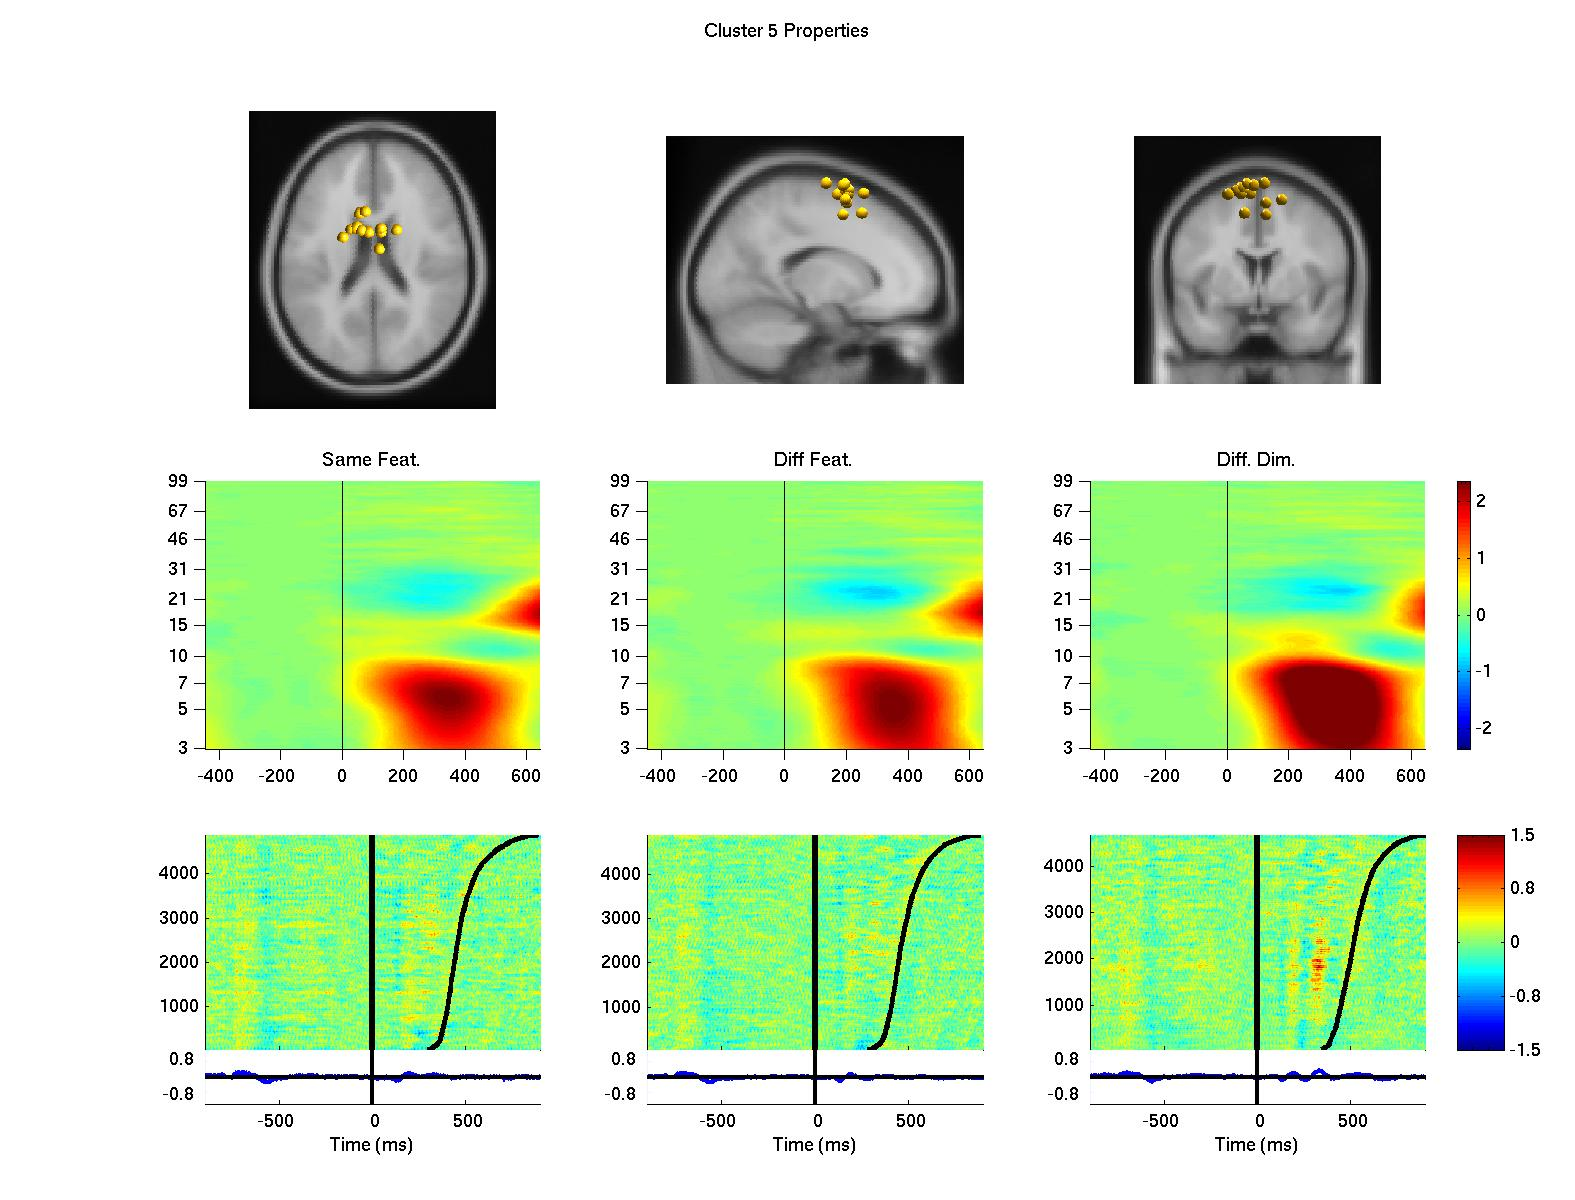
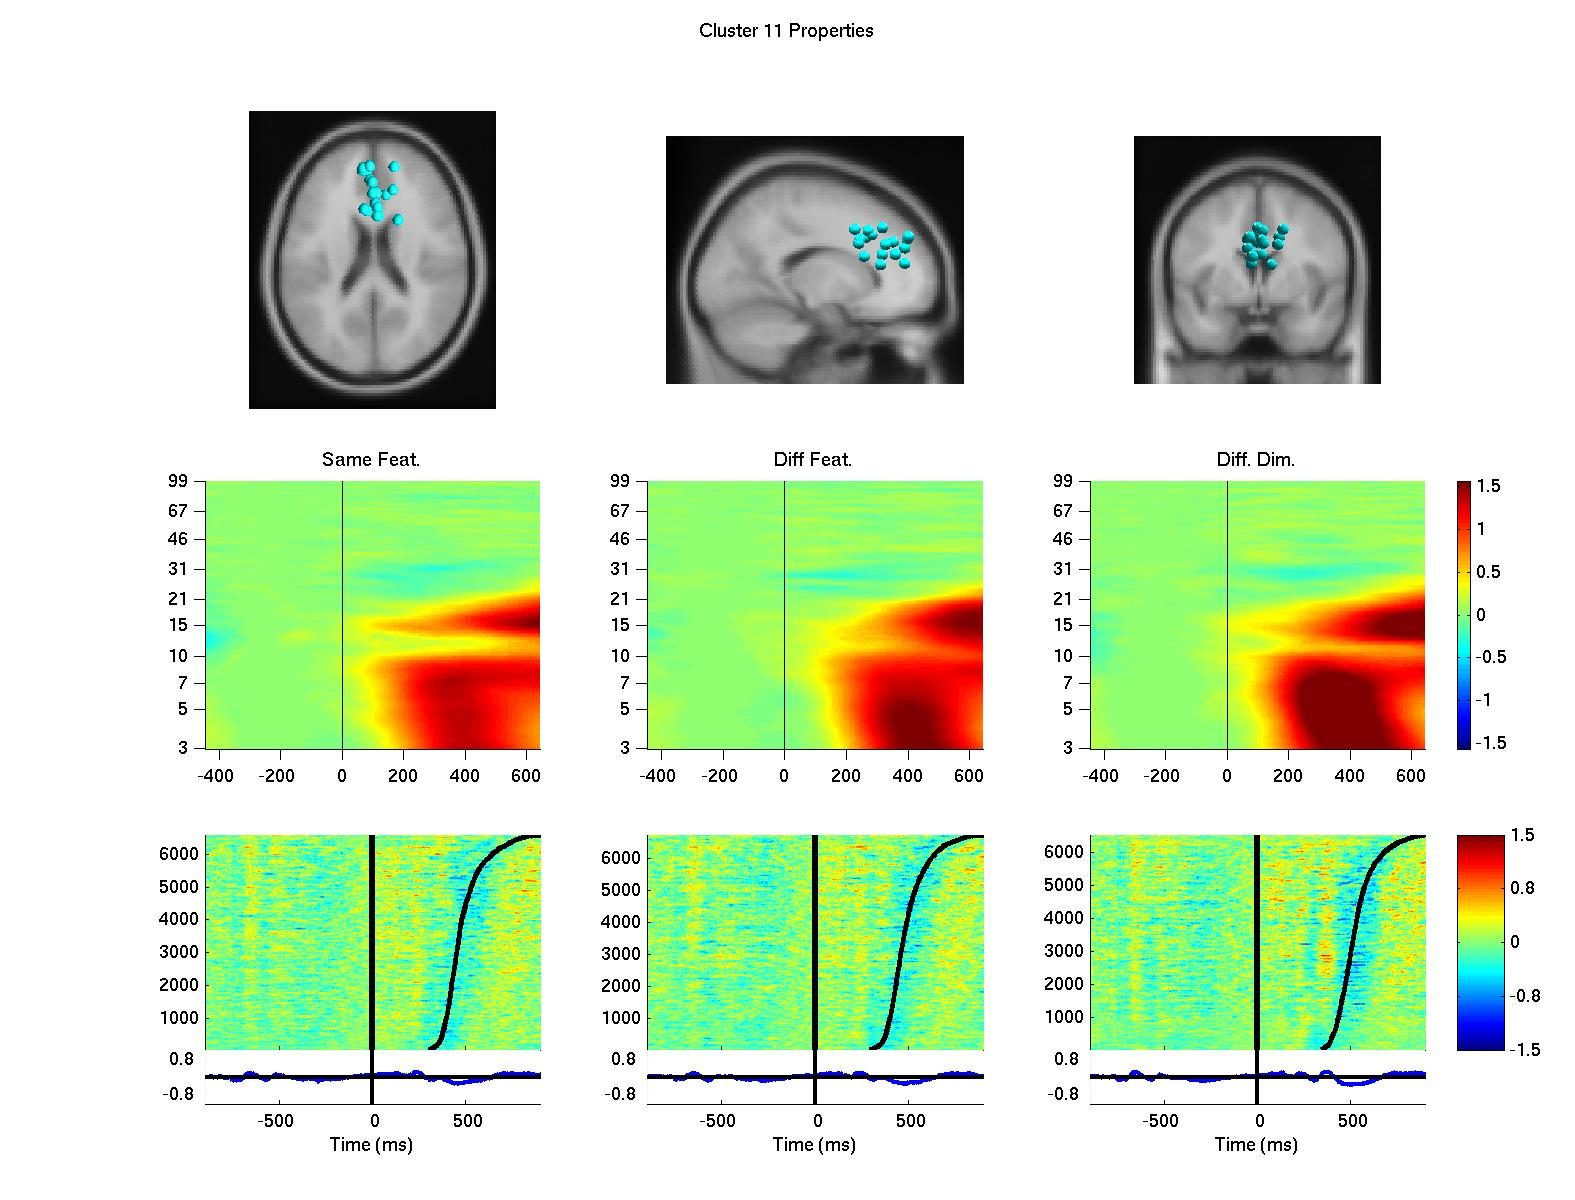
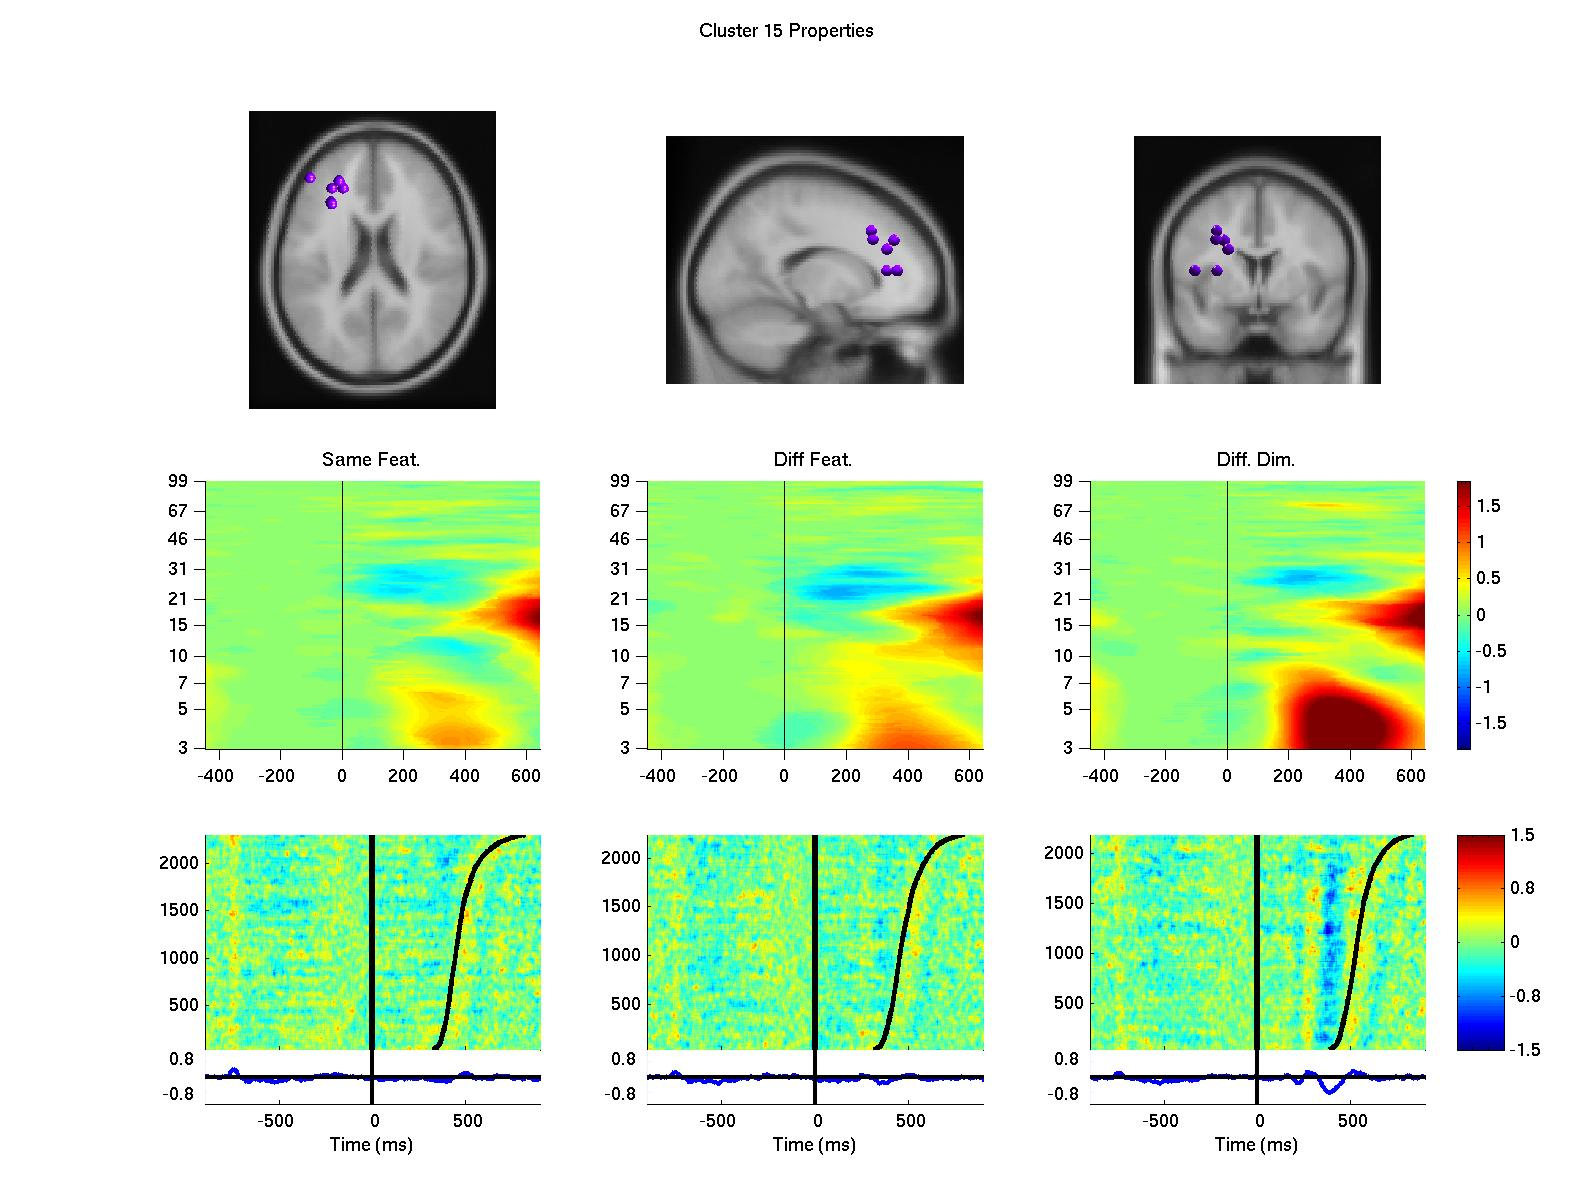
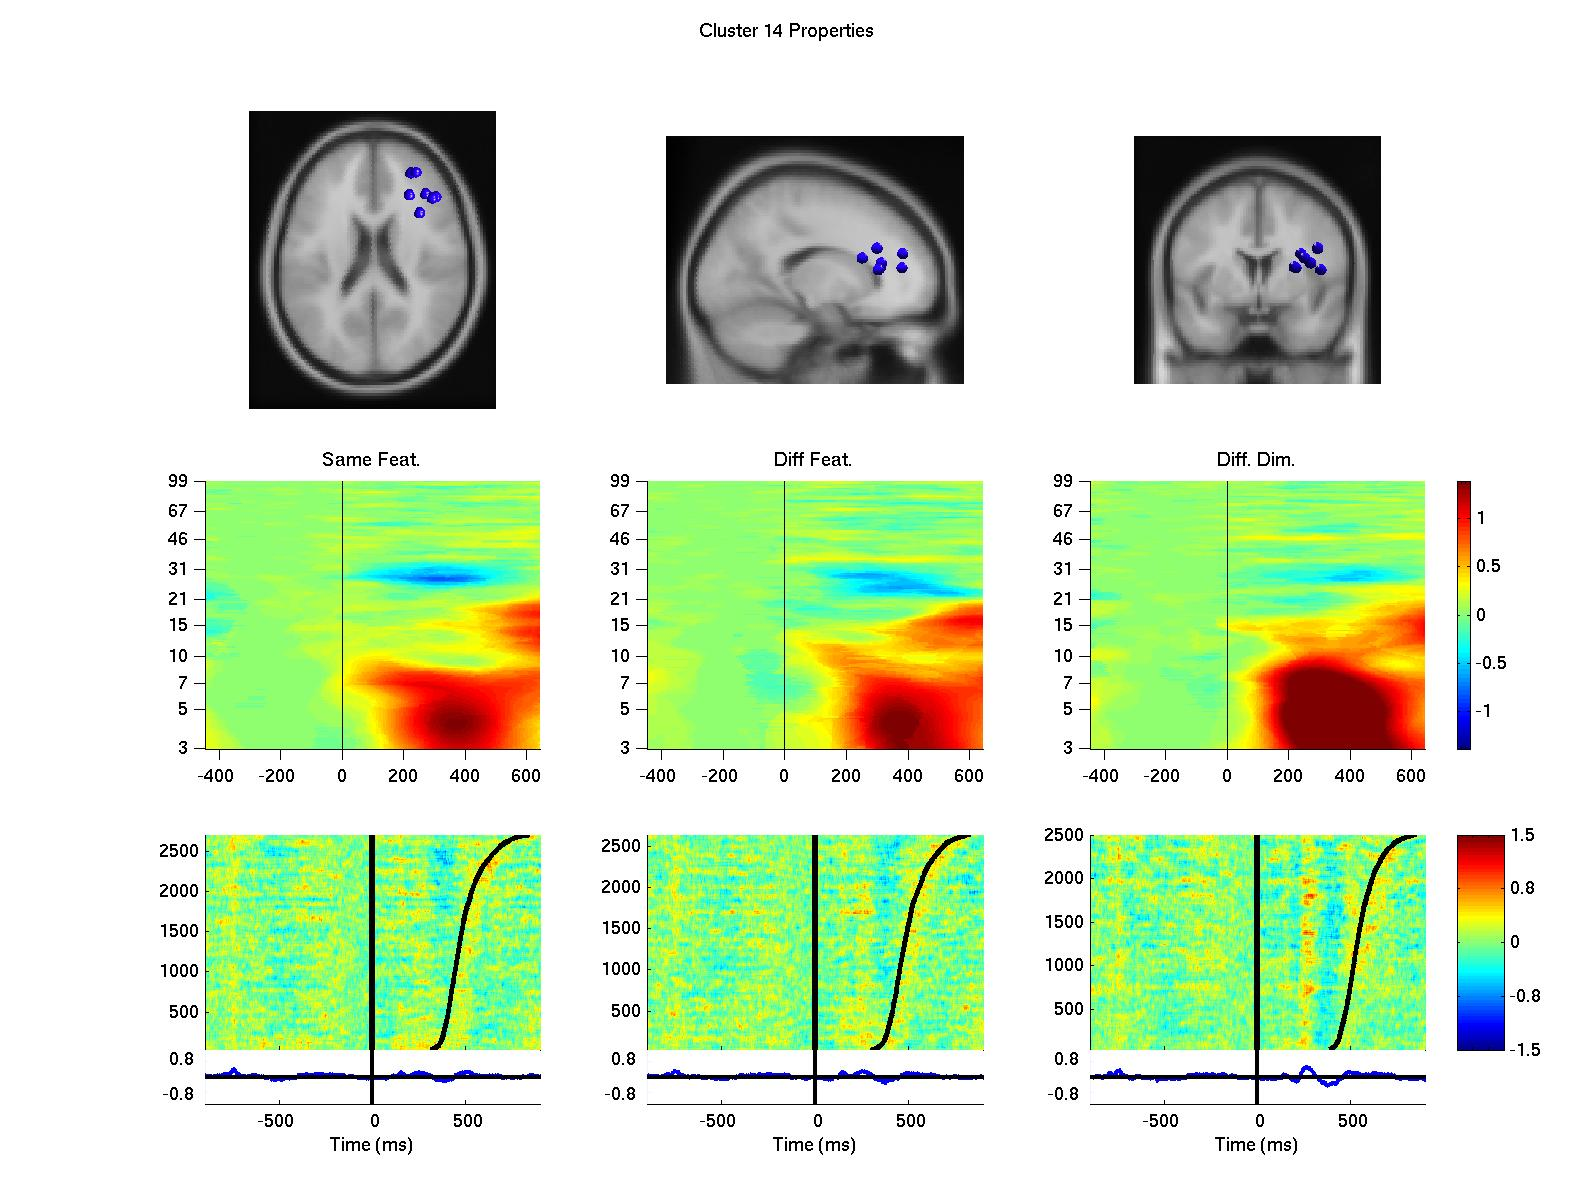
Figure 2: Clusters of independent component processes with cluster centroids (first row) located in or near the premotor cortex (left column), the anterior cingulate cortex (second from left), the left prefrontal cortex (third from left) and the right prefrontal cortex (right column). Clusters were computed using K-means algorithm based on baseline spectrum, event-related spectral perturbation, intertrial coherence, event-related potentials, scalp maps, and dipole locations. The second row displays event-related spectral perturbation of compnent clusters for same dimension same feature trials, same diemnsion different feature trials, and different dimension trials. Last row represents erp-images sorted by reaction times (second black line). The first black line indicates onset of the target display.