Fig. 2a
Figure 2a.
The grand mean response for all 20 nontarget conditions and 20
subjects. Responses at all 29 scalp channels are shown on the same
baseline. Note that N1 component peak latency differs at each electrode
site. The scalp maps illustrate the continuously shifting potential
distribution through the N1 peak. The maps have been scaled
individually to their minimum and maximum values to highlight shifts in
the scalp distribution of the response.
Figure 2b.
Scalp maps of the largest six independent components, individually
scaled (green represents zero weight). Relative locations of the
electrodes are shown by small dots. Color polarities are chosen to
represent the signs at their time point of maximum projection (red
positive, blue negative with respect to the reference). Note the
bilateral near-symmetry of the two early-N1 components (top row).
Figure 2c.
The upper (colored) traces show the grand mean target response
averaged across all 20 subjects and 5 target conditions at the 29 scalp
channels. The time series defined by the most positive and most
negative potential values across all channels at each time point may be
termed the 'envelope' of the response, as shown in the lower panel
(black traces). Conventional peak labels are shown.
Figure 2d.
Envelopes of independent components N1aL and N1aR in the grand mean
responses to non-target stimuli presented at far right, central, and
far left locations respectively. The vertical dashed lines mark 162
msec. Note the stable component peak latencies across conditions, and
their ~9 msec difference. Envelopes computed across 29 scalp channels.
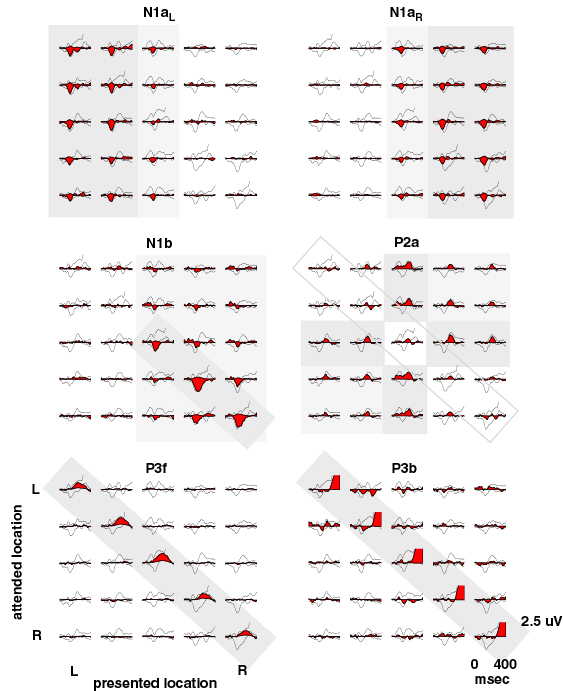
Figure 3.
Envelopes of the six largest independent components (black
outline, filled with red, from all 31 channels) (cf. Fig. 1c above),
superimposed on the mean response envelopes for all 25
Presented/Attended Location conditions. Note the systematic differences
between the sets of conditions in which the different components are
active: N1aL and N1aR (top row) are evoked by left and right visual
field stimuli, but do not appear to depend in any simple way on the
attended location. Both also respond to midline stimuli. N1b (center
left) responds to right visual field stimuli. Its amplitude is enhanced
both in attended locations and to a lesser extent in nearby right
visual field locations (locations (4,5) and (5,4)). P2a, by contrast
(middle right),
has little or no response to targets (diagonal traces).
Its amplitude is generally largest to nontarget midline stimuli.
Components P3f (lower left) and P3b
(lower right, amplitude clipped)
account for overlapping early and middle portions of the late positive
complex (
Makeig et al., J. Neurosci., 1999)
in responses to target stimuli
presented at attended locations.
Fig. 2b
Fig. 2c
Fig. 2d
Fig. 3