Tonic, Phasic, and Transient EEG Correlates of Auditory Awareness in Drowsiness
Institute for Neural Computation
University of California San Diego
and The Salk Institute
La Jolla CA 92037 and
858 453 4100 x1455
Download a (248k) gzipped Postscript (.ps.gz) version of this article.
Email authors for a reprint
Keywords: EEG sleep auditory perception theta gamma spindle ERP
During drowsiness, human performance in responding to above-threshold
auditory targets tends to vary irregularly over periods of 4 minutes
and longer. These performance fluctuations are accompanied by
distinct changes in the frequency spectrum of the electroencephalogram
(EEG) on three time scales:
(1) During minute-scale and longer
periods of intermittent responding, mean activity levels in the (< 4 Hz)
delta and (4-6 Hz) theta bands, and at the sleep spindle frequency (14 Hz)
are higher than during alert performance.
(2) In most subjects, 4-6 Hz
theta EEG activity begins to increase, and gamma band activity above 35 Hz
begins to decrease, about 10 s before presentations of undetected targets,
while before detected targets, 4-6 Hz amplitude decreases and gamma band
amplitude increases. Both these amplitude differences last 15-20 s and
occur in parallel with event-related cycles in target detection probability.
In the same periods, alpha and sleep-spindle frequency amplitudes
also show prominent 15-20 s cycles, but these are not phase locked
to performance cycles.
(3) A second or longer after undetected
targets, amplitude at intermediate (10-25 Hz) frequencies decreases
briefly, while detected targets are followed by a transient amplitude
increase in the same latency and frequency range.
Human subjects' ability to sustain their initial level of
performance during continuous auditory or visual monitoring
tasks is limited. After only a few minutes on task,
particularly in low-arousal environments, performance of
subjects in auditory or visual monitoring tasks often
includes periods of intermittent failures to respond to
above-threshold targets, alternating with periods of
consistent responding. Cycles of relatively good and poor
performance tend to last four minutes or
longer[4, 18] and
are experienced by subjects as alternating waves of drowsiness
and alertness[23].
Under sustained low-arousal conditions or
when subjects are fatigued, these drowsy periods may progress
into sleep episodes. Minute-scale changes in the probability
of detection in above-threshold signals during auditory
vigilance tasks are accompanied by simultaneous shifts in
spectral amplitude of several relatively narrow EEG frequency
bands[18],
these changes appearing to index the action of
brain mechanisms involved in modulating arousal and/or
auditory information processing in and near to sleep[26].
One hallmark of the transition from drowsiness to sleep is
the appearance of EEG sleep spindles, intermittent oscillatory
thalamocortical bursts near 14 Hz[7,
25]. Some early EEG
studies of drowsiness also associated lapses in auditory
detection with increased EEG amplitude in the theta range
(4-7 Hz)[2, 6, 23].
In this study, we explore whether lapses in
auditory detection during periods of intermittent detection
performance are accompanied by changes in the amplitude of
spontaneous EEG activity, and, in particular, whether
individual failures to detect auditory target stimuli are
more closely associated with increased activity at the
sleep spindling frequency or with theta bursts. Finally,
we report that different transient perturbations in the
EEG spectrum follow presentation of detected and undetected
auditory targets and non-target tones.
Concurrent EEG and behavioral data were collected for the
purpose of developing an objective method of monitoring
the alertness of operators of complex
systems[13, 17, 18].
Fifteen young adult volunteers participated in five half-hour
sessions each, during which they pushed one button whenever
they detected an above-threshold auditory target stimulus
(a brief increase in the level of continuous background
noise), and another button whenever they detected a visual
pattern on a computer screen in front of them (a slowly-descending
line of dots in visual noise).
Stimuli
Auditory targets consisted of 300 ms increases in the
intensity of a 62 dB white noise background (150 ms rise,
110 ms fall), presented 6 dB above their threshold of
detectibility at pseudorandom time intervals producing a
mean rate of 10/min. Brief (50 ms) non-target probe tones
of two frequencies (20% 568 Hz, 80% 1098 Hz) were interspersed
between the target noise bursts at 2-4 s intervals. Visual
targets were vertical lines of dots presented in a slowly
descending (2 lines/sec) visual noise 'waterfall' pattern
at a mean rate of 1/min. Sessions were conducted in a small,
warm, and dimly-lit experimental chamber. Visual task data
will be reported elsewhere.
Data Collection
EEG was collected from two electrodes at the vertex and
posterior midline (Cz and Pz/Oz, midway between Pz and
Oz), referred to the right mastoid, at a sampling rate of
312.5 Hz after analogue filtering (Grass Model 12, bandpass
0.1-100 Hz, 12 dB/octave). Channel locations were selected
as likely to contain independent alertness information on
the basis of previous studies[18].
Bipolar vertical and
horizontal electrooculogram (EOG) data were also recorded
for use in artifact rejection. Data windows containing
potential deviations from baseline of more than 75 uV were
rejected from analysis. Three sessions each from ten
subjects containing sufficient (mean +/- s.d., 56+/-26) response
lapses were used in the analysis.
Local Error Rate
A time-varying, causal behavioral index of alertness, local
error rate, was defined by computing a moving average
probability of detection of auditory targets smoothed using
a 95-s wide exponential moving window (90% down 95 s back)
whose width and shape were chosen to increase smoothness
of the resulting measure while decreasing the (23 s) time
lag from the leading edge of the window to its center of
gravity. Time-varying EEG spectra with 0.6 Hz resolution
were computed at 1.64-s intervals using running median
averages of FFT transforms of Hanning-windowed 0.82-s data
epochs with 50% overlap (zero-padded to 512 points / 1.64 s).
The median filtering window spanned seven overlapping
0.82-s data windows, encompassing 3.28 s of data. The four
median-filtered spectral estimates in each 1.64-s interval
were then averaged.
Error-Sorted Spectra
Changes in the EEG spectrum as a function of error rate
were computed by separately averaging log spectra in 4-second
epochs preceding detected (hit) and undetected (lapse)
target presentations, sorting these spectra according to
the prevailing error rate, and then smoothing the results
using a Hanning window (encompassing a 30% error-rate range)
which was moved through the error-sorted data in 5% error-rate
steps. The mean log spectrum during the first 2 min of
error-free performance was then subtracted from each spectral
trace, yielding hit- and lapse-related error-sorted spectra
revealing mean changes in the EEG spectrum accompanying
different levels of performance (see Fig. 1).
Spectral Perturbations
The time course of event-related changes in the amplitude
of oscillatory EEG activity time locked, but not necessarily
phase locked, to experimental events can be measured using
normalized time-frequency transforms, previously called
event-related spectral perturbations (ERSPs)[16].
Averages
of time-frequency transforms of EEG epochs time locked to
experimental events can measure event-related modulations
of EEG amplitude at a wide range of frequencies and time
scales (tenths of seconds[12]
to minutes or
longer[9, 18]).
Time- and frequency-specific ERSP features are largely
independent of concurrent features of time-domain response
averages (event-related potentials or ERPs). ERPs contain
potential deviations occurring at fixed times and in fixed
phases relative to experimental events, while ERSPs record
changes in the amplitude of EEG oscillations irrespective
of their phase at event onsets. Here, ERSPs time locked to
hit and lapse target noise bursts, and to non-target tones,
were computed by averaging logarithmic time-frequency
amplitude transforms of 54-s spectral epochs surrounding
stimulus onsets. Two types of normalization were applied
(see Fig. 2).
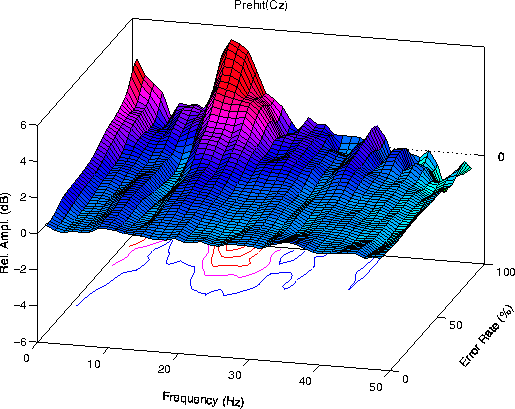
During periods of poor detection performance, the mean
error-sorted EEG spectrum at the vertex prior to lapses
Figure 1a.
Grand mean error-sorted spectra at the vertex (Cz).
Mean EEG log spectra during 4 second intervals preceding target
presentations were sorted by local error rate (see text) and
normalized by subtracting the mean log spectrum of the first two
minutes of alert zero-error performance in each session. Grand
means of data from 3 sessions for each of 10 subjects. Contour
level intervals: 1 dB. (a) Error-sorted spectrum for periods
preceding detected targets (hits) shows error rate-related increases
in low-frequency (< 4 Hz) and near-14 Hz activity.
Fig. 1a contains two prominent maxima -- relative increases
in EEG amplitude near 5 Hz and 14 Hz, plus a smaller increase
at frequencies below 5 Hz. At high error rates, mean
amplitude near 10 Hz at site Pz/Oz also decreased in most
subjects below its eyes-open baseline level. The 14-Hz peak
appears only when error rate is above 80%, consistent with
the emergence of 14-Hz spindles at sleep onset[7]).
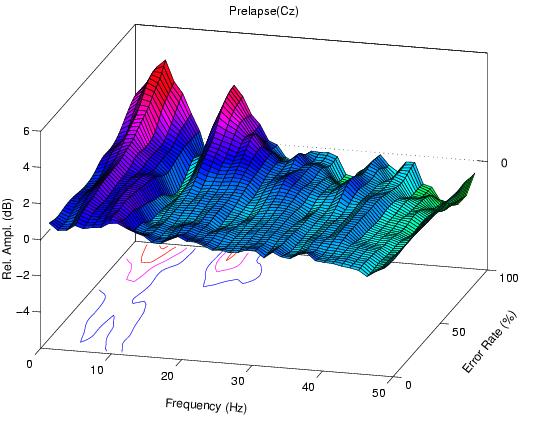
At high error rates, the error-sorted spectrum at Cz prior to hits
Figure 1b.
Error-sorted spectrum preceding undetected targets (lapses)
has another peak near 5 Hz.
Fig. 1b also contain a peak near 14 Hz, but has no peak
near 5 Hz. During high error-rate periods, 14-Hz amplitude
is nearly equally as elevated before lapses as before hits,
while in our 10 subjects mean amplitude near 5 Hz is
significantly larger before lapses at all non-zero error
rate levels (F(1,9) > 22.9, p < 0.001).
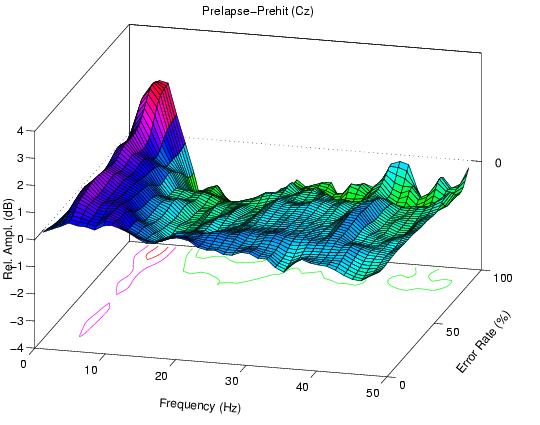
The (lapse minus hit) difference between the two error-sorted spectra
Figure 1c.
Difference between (1a) and (1b) (prelapse - prehit)
showing, during high error-rate periods, a relative increase in
near 5-Hz activity before lapses, accompanied by a relative decrease
at higher frequencies.
Fig. 1c, therefore, contains a circa 5-Hz positivity at all
error rates accompanied, at high error rates, by a general
decrease in activity above 8 Hz -- but no feature at 14 Hz.
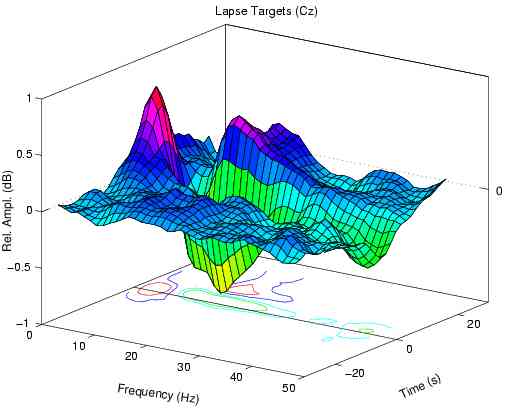
Figure 2a.
Event-related spectral perturbation (ERSP) transforms at
Cz of 56-s epochs centered on targets presented when local error
rate was between 20% and 80%. Vertical scale is log amplitude (in
dB) relative to baseline. Grand means of 30 sessions from 10
subjects. Contour levels: in (a), 1 dB in (a); in (b-d), 4 and 8
s.d. (in the first 8 s of the plotted ERSP epoch). (a) Alert-normalized
ERSP time locked to undetected targets (lapses). Note the phasic
EEG amplitude increase near 5 Hz superimposed on tonically increased
(1-6 Hz) slow activity.
Fig. 2a shows the mean changes in the EEG log spectrum at
Cz before, during, and after undetected noise burst targets
(lapses) presented during periods of intermittent (20-80%
error rate) detection performance in the same 30 sessions.
Single-session ERSPs were normalized by subtracting the
mean log spectrum during the first two minutes of error-free
performance, to show both the tonic EEG spectral changes
associated with periods of non-zero (20-80%) error rate,
and phasic EEG changes associated with detection lapses
during these periods. The figure shows the expected tonic
amplitude increase at 5 Hz and below, and also a phasic
increase near 5 Hz beginning several seconds before delivery
of undetected targets.
To study this and other features of
Fig. 2a in more detail,
time-frequency transforms of data epochs time locked to
undetected (lapse) target presentations were individually
normalized by subtracting a pre-stimulus baseline log
spectral estimate from each spectral trace. The baseline
estimate was the mean log spectrum in an exponential window
with leading edge 10 s before, and its (90%-down) trailing
edge 105 s before target onset. The resulting normalized
transforms, containing time-varying spectral fluctuations
relative to the mean spectrum in the preceding 105-s period,
were then averaged and their grand mean across subjects
and sessions was calculated. (Note that baseline periods
included an average of 17 previous target and 34 non-target
tone presentations). Target hit-related ERSP averages were
computed by the same procedure.
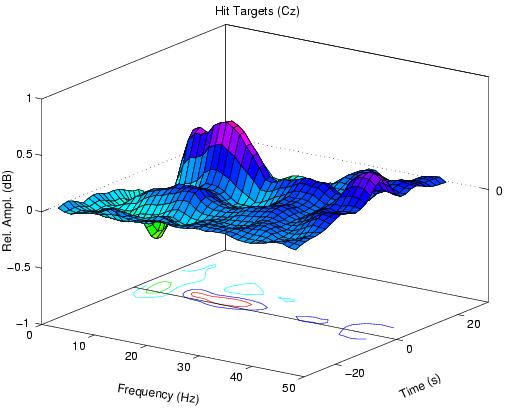
Figure 2b.
Single-trial baseline normalized ERSP
transform of the lapse-related data (see text). Note the prestimulus
increase near 5 Hz and (less noticeable) decrease near 40 Hz, and
the brief suppression of activity at intermediate frequencies after
the stimulus.
Lapse-related (Fig. 2b) and hit-related (Fig. 2c) ERSPs
differ significantly in three ways: (1) the mean increase
(or decrease) in 5-Hz activity surrounding target presentation;
(2) the opposing amplitude decrease (or increase) above 35
Hz; (3) the trough (or ridge) amplitude perturbation at
10-25 Hz appearing after hit (or lapse) target presentations,
respectively, with a frequency extremum at 11 Hz.
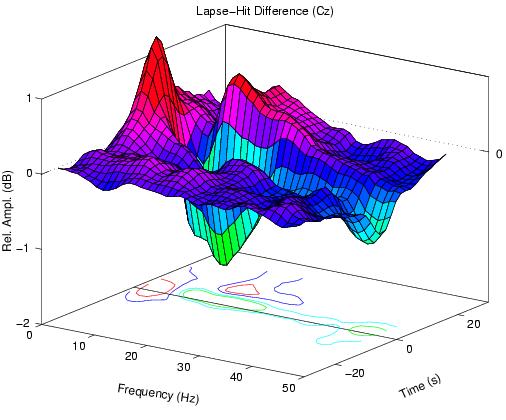
Figure 2d.
Single-trial normalized (lapse - hit) difference between (b) and
(c), containing features common to both transforms.
As the hit and lapse target ERSPs in Figs. 2b and 2c are negatively
correlated (r = -0.89), their difference (Fig. 2d) emphasizes their
common features.
Fig. 2e shows the time course of F(1,18)-statistics
for hit/lapse differences at each time point in 20 sessions
(two sessions containing the most lapses from each of the
10 subjects). The figure shows the time course of this
statistic for response-related log amplitude differences
in theta, alpha, and gamma frequency bands. Whereas these
differences in theta and gamma band activity begin nearly
10 s before the stimulus, a response-related difference in
alpha band amplitudes appears only after stimulus onset.
Next, we asked whether the phasic increases in 5-Hz activity
before and after lapses were accompanied by transient
changes in target detection probability. As might be
expected, the probability of subjects of detecting targets
presented immediately before and after detected and undetected
targets, respectively, differed from one another and from
the local error-rate baseline.
Surprisingly, both these
performance-related differences had similar and well-defined
time courses, which were quantified as the probability of
a lapse in a 1.64-s time window moved through the 58-s ERSP
epoch in 0.41-s steps.
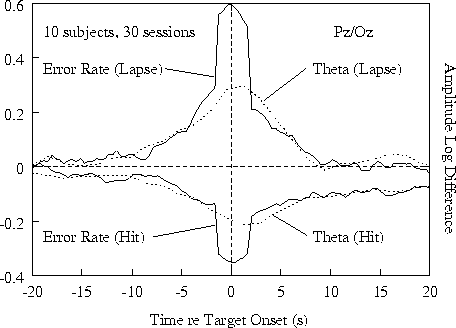
Figure 3a.
Time course of event-related error rate and relative 4-6
Hz EEG log amplitude at Pz/Oz (each smoothed in a 1.64-s moving
window) before and after the same detected (hit) and undetected
(lapse) targets as in Fig. 2a. (a) Grand means for 30 sessions from
10 subjects. Note divergence of all four measures from 10 s before
to 10 s after target presentations.
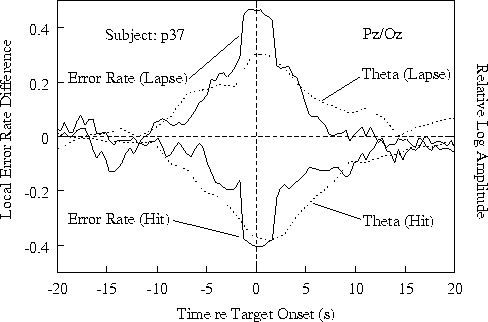
Fig. 3a shows results at site Pz/Oz;
results at Cz were similar. In this and following figures
showing event-related error rate trends, the steepness and
width of the error rate extrema at time zero reflect the
1.64-s smoothing width used and the minimum 1-s interval
between target presentations.
Ten seconds after hits, both error rate and 4-6 Hz amplitude
settled at somewhat lower levels than their pre-stimulus
baselines, presumably reflecting a net arousing effect of
target detections and/or responses.
Different sessions from the same subject gave highly similar
error-rate perturbations (Fig. 4a below) which closely parallelled
the time course of the 4-6 Hz EEG amplitude trends in group
and most single subject data (Figs. 3bc).
Figure 3b. Time course of relative
4-6 Hz log amplitude and error rate in one of the seven subjects
showing the error-rate trend seen in the grand mean (Fig 3a).
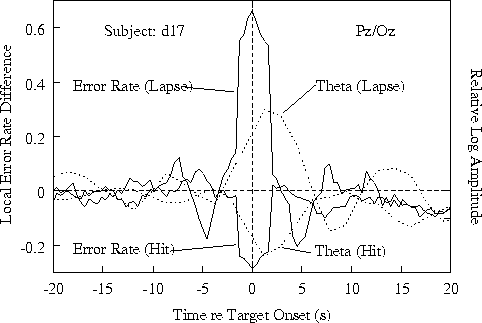
Figure 3c.
Same for one of three subjects not showing 15-20 s EEG and error-rate
cycles (see Fig. 4a).
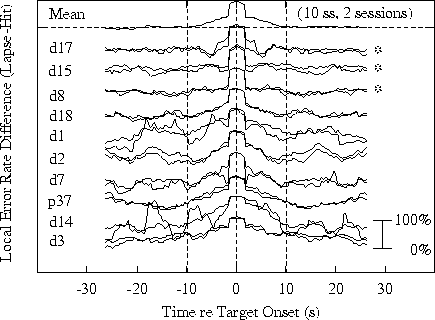
Figure 4a.
Time course of differences in response-related error-rate
time series at site Pz/Oz.
Differences between
lapse and hit event-related records (like those shown in Fig. 3)
are shown smoothed with a 1.64-s moving window. Top traces: grand
means. Lower traces: individual sessions, with pairs of sessions
from the same subject superimposed. Subjects data are arranged in
the same order in both panels, with data from the three subjects
showing no evidence of 15-20 s performance cycles marked with asterisks.
Subject codes are listed on the left of each panel.
Fig. 4a shows differences
between the time course of error rate changes time locked
to lapses and hits respectively. The top trace shows the
grand mean error-rate difference; the traces below it are
for 20 single sessions, with pairs of sessions from the
same subject superimposed.
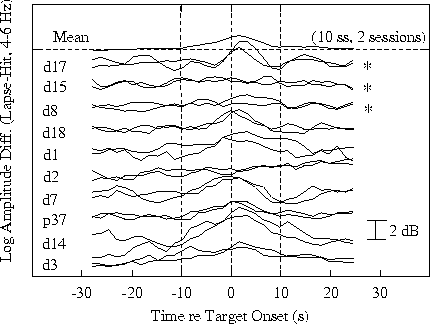
Figure 4b.
Time course of differences in response-related 4-6 Hz amplitude
time series at site Pz/Oz.
Fig. 4b shows the time course
of 4-6 Hz amplitude differences in the same sessions. Note
the strong within-subject replicability of both the
performance and amplitude cycles, and the stable between-subject
differences. The top three trace pairs in each panel are
from three subjects who do not show response-related 15-20
s performance cycles. The 4-6 Hz theta amplitude trends
for at least two of these three subjects
(Fig 4b, top two pairs) likewise contain no 15-20 s cycles.
Our results show that variations in sustained auditory
detection performance have distinct EEG spectral correlates
on three time-scales, here categorized as tonic changes,
phasic cycles, and transient perturbations.
During minute-scale and longer periods of intermittent responding,
mean EEG amplitudes in the delta (< 4 Hz), theta (4-6 Hz), and
sleep-spindle (near 14 Hz) bands tend to increase at Cz and at
Oz/Pz. During these periods, delta and 14-Hz amplitudes are equally
as large before hits as before lapses , while 4-6 Hz activity is
significantly larger before lapses than before hits.
During sleep, behavioral and brain responsiveness to sounds
is decreased, and communication of afferent auditory
information between the thalamus and auditory cortex is
restricted or gated[25, 26].
Although a tonic increase in
activity at the human sleep spindle frequency
(near 14 Hz)[7]
accompanies sustained decrements in detection probability,
14-Hz amplitude is not related to the detection of individual
targets Fig. 1c).
Our analyses do not determine what
portion of the 14-Hz peaks in Fig. 1a and 1b reflect the
appearance of classic sleep spindles. However, the lack of
a 14-Hz feature in Fig. 1c strongly suggests that sleep
spindles, hallmarks of transition to slow-wave sleep, cannot
be directly involved in intermittent gating of sensory
information during drowsiness, although they may have a
role in producing tonic changes in auditory sensitivity
during sleep onset[25].
The most important conclusion to be drawn from the error-sorted
spectra (Fig. 1) is that during periods of intermittent
performance, individual detection lapses are associated
with increased activity near 5 Hz, not with 14-Hz sleep
spindles or increased delta activity. ERSP (Fig. 2) and
event-related error-rate (Fig. 3) analyses demonstrate that
the observed 4-6 Hz differences arise from phase-locking
of 15-20 s EEG and performance cycles.
During periods of inconsistent responding, seven
of our ten subjects
show 15-20 s cycles in detection probability, closely paralleled
by opposing changes in EEG amplitudes near 5 Hz and above 35 Hz.
In accord with claims of early EEG studies, undetected targets are
preceded by increased activity near 5 Hz, while in our experiments
EEG activity above 35 Hz tends to increase prior to detected targets.
Second-order spectral analyses of amplitude variance at
each EEG frequency (not shown), applied to the same epochs
used to compute the ERSPs (Fig. 2), revealed a peak cycle
length between 15 and 20 s per cycle over a wide range of
EEG frequencies, consistent with other reports[19].
The 15-20 s theta and gamma perturbations in Fig. 3a, then, may result
from mutual phase locking of spontaneous amplitude fluctuations
at these frequencies, uncorrelated with 15-20 s fluctuations
at lower (< 4 Hz) and intermediate frequencies (10-25 Hz).
The fact that the theta-band amplitude cycles are also time
locked to performance cycles (Fig. 3a) suggests that
intermittent gating of auditory information transmission
during drowsiness may be intimately connected to 4-6 Hz
activity.
While potential neurophysiological mechanisms for this phenomena have been
discussed[25, 26],
the behavioral and physiological distinction we report here between
spindling-frequency activity and the sleep-related theta
rhythm does not seem to have been observed in animal brains.
[NOTE: However, 20 s cycles in EEG amplitude have
been shown to be synchronized to sleep onset in neocortex of rats
(Oakson & Steriade, 1983, Fig. 3].
Note that we cannot rule out possibilities that some or
all lapses in these experiments arose from subjects
sleep-related inability to recall the significance of the
tones, or from an inability to press the response button,
although in our own experience as subject (tpj) and pilot
subject (sm), all three dimensions of awareness (auditory,
situational, and somatic) seemed to covary.
This is not the first report that changes in theta and
gamma band EEG amplitudes are linked to changes in attention
and awareness[8, 11].
Intermittent vigilance decrements similar
to the 15-20 s cycles we report here have recently been
reported in monkeys performing a continuous visual task,
and have been correlated with cyclic decreases in locus
coeruleus activity[21].
Conversely, noradrenergic locus
coeruleus activation is known to produce behavioral alerting,
accompanied by a rapid shift of the cortical EEG spectrum
from low to high frequencies[27].
Possibly, a similar modulator
may underlie the 15-20 s performance and EEG fluctuations
seen both in quietly resting[19]
and here in drowsy humans.
More than one brain arousal subsystem may also be involved
in producing them[25].
Our observed pre-stimulus increase in theta-band EEG prior
to lapses in these experiments confirms and further quantifies
early reports[6],
most notably a 1962 study of Williams et
al.28 in which this phenomenon was seen in EEG tracings of
some subjects after 30 hours of sleep deprivation. In other
early EEG studies, "low-level irregular" theta activity
was associated with self-reports of daydreaming and "floating"
sensations typical of the hypnagogic period preceding sleep
onset[23].
Most recent studies of theta band EEG, however,
have focussed on dissimilar phenomena associated with
arousal and attention, including rhythmic slow activity
(RSA) in the septohippocampal and related system appearing
in animals during volitional movements[14]
and frontal midline theta EEG in humans associated with
mental effort[10].
The increased gamma-band activity preceding detected targets
in our data is compatible with hypotheses that transient
phase correlations among local gamma band oscillations in
the cortex and thalamus may help support allocation of
perceptual attention[5, 8, 15,
22]. Although we cannot rule out possible contributions of muscle activity to changes in
gamma band activity prior to detected or undetected targets,
muscle activity normally contains frequencies below 35 Hz,
the lower edge of our performance-related gamma-band
difference, suggesting that the phasic gamma band phenomenon
shown in Fig. 2 arises predominately from performance-related
changes in brain activity.
Successfully detected auditory targets are followed by a brief
increase in 10-25 Hz EEG activity beginning a second or more after
stimulus onset, while undetected targets are followed by a brief
relative amplitude decrease in the same time and frequency range.
The appearance of 10-25 Hz spectral perturbations following
(but not preceding) undetected (Fig. 2b) as well as detected
(Fig. 2c) targets implies that the brain system responsible
for these EEG modulations also detects lapse targets, to
which subjects do not respond. ERSPs (not shown) time locked
to onsets of the frequent (16/min) non-target tones in
these sessions contained no comparable response feature,
implying that the EEG modulator responsible for the 10-25
Hz response can also distinguish target noise bursts from
non-target tones, even though the non-target tones in these
experiments were perceptually more salient than the relatively
faint target noise bursts. Similarly, in auditory experiments
reported earlier[16],
a ridge of augmented 11-19 Hz activity
induced by very brief target tone pips was found to be
twice as large that induced by intense (84 dB SL), long-lasting
(1 s) non-target tones.
Note that this attention-related 10-25 Hz perturbation
appears much later than attention-related features of the
auditory ERP, such as the P300, but closer in latency to
attention-related autonomic responses such as the evoked
pupillary response1. In general, the magnitudes of ERSP
features (0.5 - 2 dB, 5 - 25%) in this and previously-reported
experiments are comparable in size to task-related differences
in local brain metabolism reported in many PET and fMRI
brain studies[20, 24],
suggesting a possible relation between
EEG spectral perturbations and the size of local brain
blood-flow changes.
Concurrent activity on a wide range of time scales is a
basic fact of brain physiology[3].
Our results show that
during periods of impaired performance on an auditory
vigilance task, at least three time scales characterize
the dynamics of variations in auditory detection performance
and the EEG spectrum. Overall, changes in error rate in
auditory detection are dominated by irregular waves of
performance changes lasting four minutes and longer[4,
18].
Within these, phasic 15-20 s cycles in detection performance
are phase locked to counterbalanced changes in EEG amplitudes
near 5 Hz and above 35 Hz, respectively. Finally, auditory
stimuli induce transient and variable perturbations in the
EEG amplitude spectrum which can be observed by averaging
normalized time-frequency transforms (ERSPs) of event-related
data epochs. In particular, faint target noise bursts (but
not more salient non-target tones) in our experiments induce
transient time locked perturbations in mean EEG amplitudes
at intermediate frequencies (10-25 Hz), whose sign (positive
or negative) depends on whether or not the subject responds
to the target. Further understanding of characteristic
time and frequency scales involved in cognitive brain processing
during sleep and waking may lead to a deeper appreciation of the
organization of human consciousness and performance, and may also
have practical applications in monitoring the alertness of operators
of complex systems[13, 17].
The authors acknowledge the valuable contributions of F.
Scot Elliott and Mark Postal in collecting and archiving
the data, and thank Mark Inlow and two anonymous reviewers
for helpful suggestions, and Terry Sejnowski for technical
support. This research was supported by work unit
ONR.WR.30020(6429) from the Office of Naval Research.
Disclaimer.
This work was supported by the Department of the Navy,
Naval Medical Research and Development Command, Bethesda, Maryland under
work unit ONR.WR.30020(6429).The views expressed in this article are
those of the authors and do not reflect the official policy or
position of the Department of the Navy, Department of Defense, nor
the U.S. Government. Approved for release, distribution unlimited.
Summary
Methods and Materials
Results
Discussion
Conclusions
Acknowledgements
References
Introduction
Materials and Methods
Results
Error-Sorted Spectra
Spectral Perturbations

Performance Cycles
Discussion
Tonic Changes
Phasic Cycles
Transient Perturbations
Conclusions
Acknowledgements
References
Return to Summary.