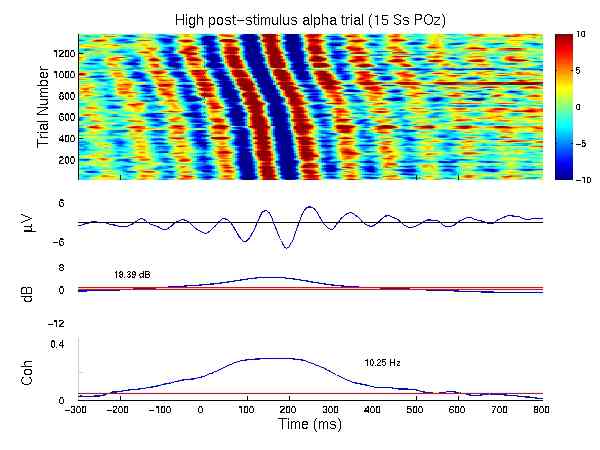
Figure 1. ERP image of 1300 color-coded single trials from 15 Ss in a visual selective attention experiment, sorted by alpha phase in a 300-msec wide post-stimulus window. Note the non-uniform phase distribution. Top trace: the trial average. Note the relationship to the trial distribution. Middle trace: Time course of alpha amplitude. The post-stimulus peak was produced by rejecting trials with low post-stimulus alpha power. Bottom trace: Time course of Inter-Trial Coherence (ITC), measuring phase locking at (10.25 Hz) to stimulus onsets (at time 0).