

Figure 2
|
|
|
|
|
|
|
|
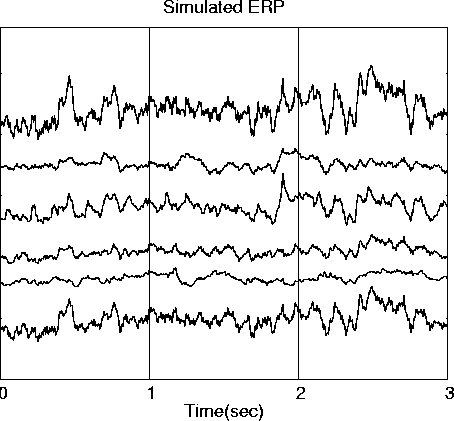
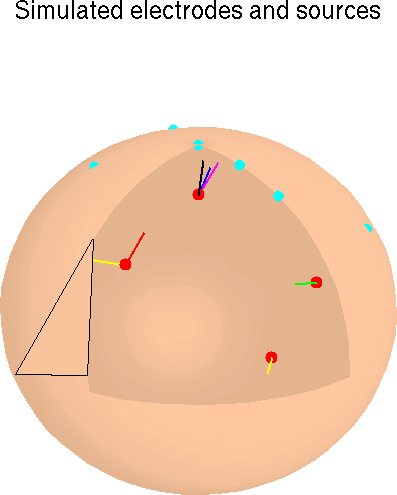
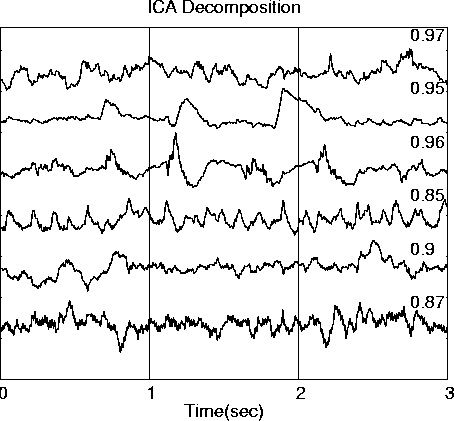
Figure 2. ICA decomposition of simulated brief EEG data epochs derived from six 3-second (600-point) ECoG data epochs drawn from different times and channels in a 12-minute ECoG data set (a, upper left) and simulating the activities of six independent brain ERP sources. Projecting this source data through six one- and two-dipole simulated sources in a 3-layer spherical shell head model (c, lower left) produces a simulated 600-point EEG data epoch (b, upper right). ICA decomposition of this data epoch produces six ICA component waveforms (d, lower right). Correlations between each ICA component waveform and its best-correlated input source waveform are shown on the right side of (d, lower right).