The EEGLAB News #7
IMAT Plugin
A plug-in toolbox, IMAT (for Independent Modulator Analysis Toolbox), has been developed by Johanna Wagner & Ramon Martinez-Cancino with Scott Makeig based on earlier work by Julie Onton and Scott (Onton & Makeig, 2006, 2007, 2009) for decomposing spectral fluctuations of temporally independent EEG sources into ‘spatio-spectrally’ distinct spectral modulator processes. Such processes may identify coordinated multiplicative scaling effects of functionally distinct modulatory influences, for example cortical-subcortical feedback loops or brainstem-originating event import recognition systems involving neuromodulatory transmitters such as dopamine, serotonin, noradrenaline, etc. They also, for example, separate alpha harmonics from distinct beta activities, broadband from narrow band high-frequency activities, etc. Rather than modeling a mean spectrum as a sum of 1/f noise plus narrow-band oscillations, for example, IMA models spectral variation in the activities of identified independent brain sources across the recording period.
Many studies of EEG spectral dynamics separate spectrographic data into a set of pre-defined broad or narrow frequency bands, then extract and operate on measures of these bands. However, to better understand the functional  roles of local field dynamics contributing to the EEG, as well as individual differences in oscillatory dynamics, more flexible, data-driven models of spectral dynamics are needed. In the IMA method, multi-channel EEG data are first spatially decomposed using independent component analysis (ICA) into maximally independent component (IC) source processes. Then the temporal fluctuations in the concurrent joint IC log spectrograms are decomposed into independent modulator (IM)processes that are maximally independent over sources and frequency-weighting.
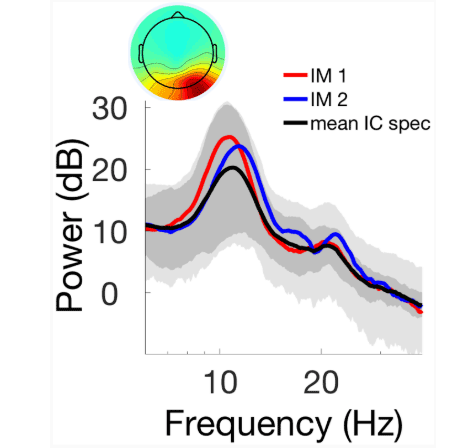
(Image: Maximal effects of two (higher and lower frequency) alpha band independent modulators (IMs) on the mean log spectrum of an independent component (IC) process in the right occipital lobe. The IC mean log power spectrum is shown as a black trace. Outer light grey limits represent the 1st and 99th percentiles of IC spectral variation. Dark grey areas represent the 1st and 99th percentiles of the PCA-reduced spectral data used in the IMA analysis. Note the inclusion in the IM templates the associated harmonic peaks near 20 Hz).
IMA decomposition can be useful for a number of applications, for example to determine the inter-relationship of observed alpha modulations in brain source-resolved EEG data (Onton & Makeig, 2006; Wagner et al. in preparation) or to specify and source localize a natural mode of high-frequency broadband activity carrying emotion information separately from EMG contamination (Onton & Makeig, 2007, 2009). The IMAT plugin is available on the EEGLAB plugin manager.
References
Onton, J., and Makeig, S. (2006). Co-modulation of spectral power between maximally independent brain sources. Poster presentation, Human Brain Mapping Society, Florence, Italy.
Onton, J. and Makeig, S. (2006). EEG spectral modulations involved in self-regulation of independent component alpha power. Society for Neuroscience, Florence, Italy.
Onton, J. and Makeig, S. (2007). Independent modulations of high-gamma band spectral activity in human scalp EEG distinct from scalp muscle activity. Poster presentation, Human Brain Mapping Society, Chicago, Illinois.
Onton, J. and Makeig, S. (2009) Independent modulators of regional EEG alpha sub-band power during a working memory task. Poster presentation, Cognitive Neuroscience Society,
Onton, J.A. and Makeig, S. (2009). High-frequency broadband modulation of electroencephalographic spectra. Frontiers in human neuroscience, 3, pp. 61-.